
Page 16 - 2023-bfw-Macro-Krugman-Econ-4e
P. 16
ModULE 1.2
Adventures in
®
AP Economics
Module 1.2 Review Watch the video:
Production Possibilities Curve
Check Your Understanding
1. True or false? Explain your answer. gathered results in a change in her production
a. An increase in the amount of resources available to possibilities curve.
Alexis for use in producing coconuts and fish does c. Points inside a production possibilities curve
not change her production possibilities curve. are efficient, and points outside a production
b. A technological change that allows Alexis to catch possibilities curve are inefficient.
more fish relative to any amount of coconuts
®
Tackle the AP Test: Multiple-Choice Questions
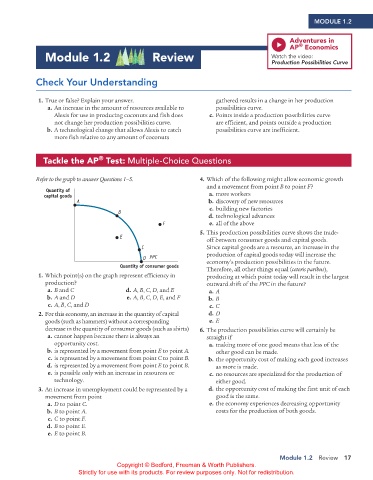
Refer to the graph to answer Questions 1–5. 4. Which of the following might allow economic growth
and a movement from point B to point F?
Quantity of
capital goods a. more workers
A b. discovery of new resources
c. building new factories
B
d. technological advances
F e. all of the above
5. This production possibilities curve shows the trade-
E
off between consumer goods and capital goods.
C Since capital goods are a resource, an increase in the
production of capital goods today will increase the
D PPC
Quantity of consumer goods economy’s production possibilities in the future.
Therefore, all other things equal (ceteris paribus),
1. Which point(s) on the graph represent efficiency in producing at which point today will result in the largest
production? outward shift of the PPC in the future?
a. B and C d. A, B, C, D, and E a. A
b. A and D e. A, B, C, D, E, and F b. B
c. A, B, C, and D c. C
2. For this economy, an increase in the quantity of capital d. D
goods (such as hammers) without a corresponding e. E
decrease in the quantity of consumer goods (such as shirts) 6. The production possibilities curve will certainly be
a. cannot happen because there is always an straight if
opportunity cost. a. making more of one good means that less of the
b. is represented by a movement from point E to point A. other good can be made.
c. is represented by a movement from point C to point B. b. the opportunity cost of making each good increases
d. is represented by a movement from point E to point B. as more is made.
e. is possible only with an increase in resources or c. no resources are specialized for the production of
technology. either good.
3. An increase in unemployment could be represented by a d. the opportunity cost of making the first unit of each
movement from point good is the same.
a. D to point C. e. the economy experiences decreasing opportunity
b. B to point A. costs for the production of both goods.
c. C to point F.
d. B to point E.
e. E to point B.
Module 1.2 Review 17
Copyright © Bedford, Freeman & Worth Publishers.
Strictly for use with its products. For review purposes only. Not for redistribution.
02_APKrugman4e_40932_MacroU01_002_062.indd 17 05/07/22 10:50 AM