Page 39 - 2023-bfw-Macro-Krugman-Econ-4e
P. 39

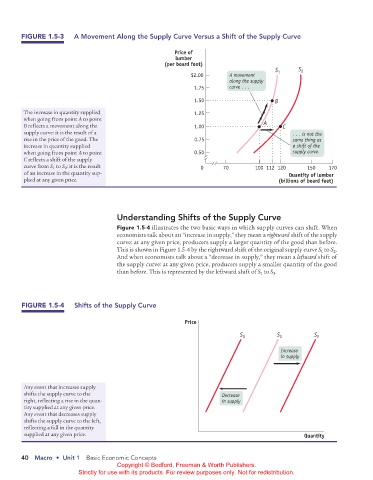
FIGURE 1.5-3      A Movement Along the Supply Curve Versus a Shift of the Supply Curve


                                                                 Price of
                                                                 lumber
                                                              (per board foot)
                                                                                                  S      S 2
                                                                      $2.00        A movement      1
                                                                                   along the supply
                                                                       1.75        curve . . .

                                                                       1.50                       B
                The increase in quantity supplied                      1.25
                when going from point A to point
                B reflects a movement along the                        1.00                   A     C
                supply curve: it is the result of a                                                     . . . is not the
                rise in the price of the good. The                     0.75                             same thing as
                increase in quantity supplied                                                           a shift of the
                when going from point A to point                       0.50                             supply curve.
                C reflects a shift of the supply
                curve from S 1  to S 2 : it is the result                0       70        100 112 120      150    170
                of an increase in the quantity sup-                                                   Quantity of lumber
                plied at any given price.                                                          (billions of board feet)


                                              Understanding Shifts of the Supply Curve

                                              Figure 1.5-4 illustrates the two basic ways in which supply curves can shift. When
                                              economists talk about an “increase in supply,” they mean a rightward shift of the supply
                                              curve: at any given price, producers supply a larger quantity of the good than before.
                                              This is shown in Figure 1.5-4 by the rightward shift of the original supply curve S  to S .
                                                                                                                     2
                                                                                                                 1
                                              And when economists talk about a “decrease in supply,” they mean a leftward shift of
                                              the supply curve: at any given price, producers supply a smaller quantity of the good
                                              than before. This is represented by the leftward shift of S  to S .
                                                                                                 3
                                                                                             1


               FIGURE 1.5-4    Shifts of the Supply Curve


                                                                    Price

                                                                                      S 3         S 1          S 2

                                                                                                    Increase
                                                                                                    in supply


                Any event that increases supply
                shifts the supply curve to the                                  Decrease
                right, reflecting a rise in the quan-                           in supply
                tity supplied at any given price.
                Any event that decreases supply
                shifts the supply curve to the left,
                reflecting a fall in the quantity
                supplied at any given price.                                                               Quantity


               40  Macro  •  Unit 1  Basic Economic Concepts
                                              Copyright © Bedford, Freeman & Worth Publishers.
                                 Strictly for use with its products. For review purposes only. Not for redistribution.


          02_APKrugman4e_40932_MacroU01_002_062.indd   40                                                              05/07/22   10:51 AM
   34   35   36   37   38   39   40   41   42   43   44