
Page 35 - 2023-bfw-Macro-Krugman-Econ-4e
P. 35
®
Tackle the AP Test: Multiple-Choice Questions
Refer to the table to answer Questions 1 and 2. 4. A decrease in the price of butter would most likely
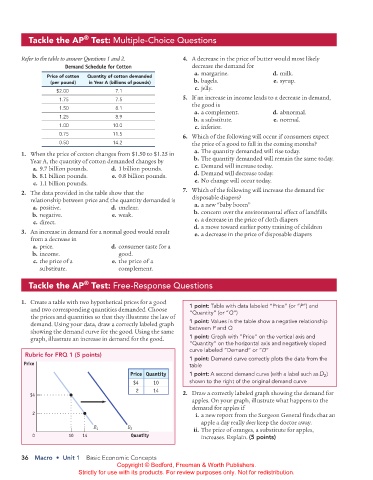
Demand Schedule for Cotton decrease the demand for
a. margarine. d. milk.
Price of cotton Quantity of cotton demanded
(per pound) in Year A (billions of pounds) b. bagels. e. syrup.
c. jelly.
$2.00 7.1
1.75 7.5 5. If an increase in income leads to a decrease in demand,
the good is
1.50 8.1
a. a complement. d. abnormal.
1.25 8.9
b. a substitute. e. normal.
1.00 10.0 c. inferior.
0.75 11.5 6. Which of the following will occur if consumers expect
0.50 14.2 the price of a good to fall in the coming months?
a. The quantity demanded will rise today.
1. When the price of cotton changes from $1.50 to $1.25 in
Year A, the quantity of cotton demanded changes by b. The quantity demanded will remain the same today.
a. 9.7 billion pounds. d. 1 billion pounds. c. Demand will increase today.
b. 8.1 billion pounds. e. 0.8 billion pounds. d. Demand will decrease today.
c. 1.1 billion pounds. e. No change will occur today.
2. The data provided in the table show that the 7. Which of the following will increase the demand for
relationship between price and the quantity demanded is disposable diapers?
a. positive. d. unclear. a. a new “baby boom”
b. negative. e. weak. b. concern over the environmental effect of landfills
c. direct. c. a decrease in the price of cloth diapers
d. a move toward earlier potty training of children
3. An increase in demand for a normal good would result e. a decrease in the price of disposable diapers
from a decrease in
a. price. d. consumer taste for a
b. income. good.
c. the price of a e. the price of a
substitute. complement.
®
Tackle the AP Test: Free-Response Questions
1. Create a table with two hypothetical prices for a good 1 point: Table with data labeled “Price” (or “P”) and
and two corresponding quantities demanded. Choose “Quantity” (or “Q”)
the prices and quantities so that they illustrate the law of
demand. Using your data, draw a correctly labeled graph 1 point: Values in the table show a negative relationship
between P and Q
showing the demand curve for the good. Using the same
graph, illustrate an increase in demand for the good. 1 point: Graph with “Price” on the vertical axis and
“Quantity” on the horizontal axis and negatively sloped
curve labeled “Demand” or “D”
Rubric for FRQ 1 (5 points) 1 point: Demand curve correctly plots the data from the
Price table
D )
Price Quantity 1 point: A second demand curve (with a label such as 2
$4 10 shown to the right of the original demand curve
2 14
$4 2. Draw a correctly labeled graph showing the demand for
apples. On your graph, illustrate what happens to the
demand for apples if
2 i. a new report from the Surgeon General finds that an
apple a day really does keep the doctor away.
D 1 D 2 ii. The price of oranges, a substitute for apples,
0 10 14 Quantity increases. Explain. (5 points)
36 Macro • Unit 1 Basic Economic Concepts
Copyright © Bedford, Freeman & Worth Publishers.
Strictly for use with its products. For review purposes only. Not for redistribution.
02_APKrugman4e_40932_MacroU01_002_062.indd 36 05/07/22 10:50 AM