
Page 46 - 2023-bfw-Macro-Krugman-Econ-4e
P. 46
ModULE 1.6
Finding the Equilibrium Price and Quantity AP ECoN TIP
®
The easiest way to determine the equilibrium price and quantity in a market is by Equilibrium price and
putting the supply curve and the demand curve on the same diagram. Since the quantity are found where the
supply curve shows the quantity supplied at any given price and the demand curve supply and demand curves
shows the quantity demanded at any given price, the price at which the two curves intersect on the graph, but
cross is the equilibrium price: the price at which quantity supplied equals quantity the values for price and
demanded. quantity must be shown
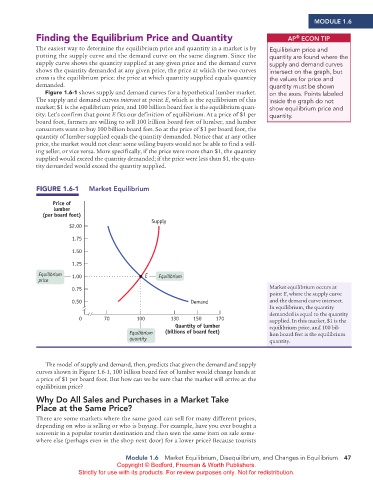
Figure 1.6-1 shows supply and demand curves for a hypothetical lumber market. on the axes. Points labeled
The supply and demand curves intersect at point E, which is the equilibrium of this inside the graph do not
market; $1 is the equilibrium price, and 100 billion board feet is the equilibrium quan- show equilibrium price and
tity. Let’s confirm that point E fits our definition of equilibrium. At a price of $1 per quantity.
board foot, farmers are willing to sell 100 billion board feet of lumber, and lumber
consumers want to buy 100 billion board feet. So at the price of $1 per board foot, the
quantity of lumber supplied equals the quantity demanded. Notice that at any other
price, the market would not clear: some willing buyers would not be able to find a will-
ing seller, or vice versa. More specifically, if the price were more than $1, the quantity
supplied would exceed the quantity demanded; if the price were less than $1, the quan-
tity demanded would exceed the quantity supplied.
FIGURE 1.6-1 Market Equilibrium
Price of
lumber
(per board foot)
Supply
$2.00
1.75
1.50
1.25
Equilibrium 1.00 E Equilibrium
price
0.75 Market equilibrium occurs at
point E, where the supply curve
0.50 Demand and the demand curve intersect.
In equilibrium, the quantity
demanded is equal to the quantity
0 70 100 130 150 170 supplied. In this market, $1 is the
Quantity of lumber equilibrium price, and 100 bil-
Equilibrium (billions of board feet) lion board feet is the equilibrium
quantity quantity.
The model of supply and demand, then, predicts that given the demand and supply
curves shown in Figure 1.6-1, 100 billion board feet of lumber would change hands at
a price of $1 per board foot. But how can we be sure that the market will arrive at the
equilibrium price?
Why do All Sales and Purchases in a Market Take
Place at the Same Price?
There are some markets where the same good can sell for many different prices,
depending on who is selling or who is buying. For example, have you ever bought a
souvenir in a popular tourist destination and then seen the same item on sale some-
where else (perhaps even in the shop next door) for a lower price? Because tourists
Module 1.6 Market Equilibrium, Disequilibrium, and Changes in Equilibrium 47
Copyright © Bedford, Freeman & Worth Publishers.
Strictly for use with its products. For review purposes only. Not for redistribution.
02_APKrugman4e_40932_MacroU01_002_062.indd 47 05/07/22 10:51 AM