
Page 129 - Demo
P. 129
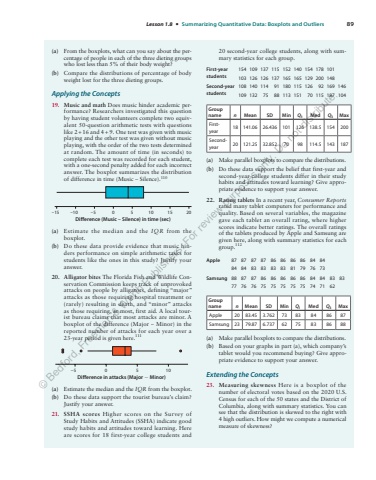
Lesson 1.8 %u2022 Summarizing Quantitative Data: Boxplots and Outliers 89(a) From the boxplots, what can you say about the percentage of people in each of the three dieting groups who lost less than 5% of their body weight?(b) Compare the distributions of percentage of body weight lost for the three dieting groups.Applying the Concepts19. Music and math Does music hinder academic performance? Researchers investigated this question by having student volunteers complete two equivalent 50-question arithmetic tests with questions like 2 +16 and 4 9 + . One test was given with music playing and the other test was given without music playing, with the order of the two tests determined at random. The amount of time (in seconds) to complete each test was recorded for each student, with a one-second penalty added for each incorrect answer. The boxplot summarizes the distribution of difference in time (Music %u2212 Silence).110%u201315 %u201310 %u20135 0 5 10 15 20Difference (Music %u2013 Silence) in time (sec)(a) Estimate the median and the IQR from the boxplot.(b) Do these data provide evidence that music hinders performance on simple arithmetic tasks for students like the ones in this study? Justify your answer.20. Alligator bites The Florida Fish and Wildlife Conservation Commission keeps track of unprovoked attacks on people by alligators, defining %u201cmajor%u201d attacks as those requiring hospital treatment or (rarely) resulting in death, and %u201cminor%u201d attacks as those requiring, at most, first aid. A local tourist bureau claims that most attacks are minor. A boxplot of the difference (Major %u2212 Minor) in the reported number of attacks for each year over a 23-year period is given here.111%u22125 0Difference in attacks (Major 2 Minor)5 10(a) Estimate the median and the IQR from the boxplot.(b) Do these data support the tourist bureau%u2019s claim? Justify your answer.21. SSHA scores Higher scores on the Survey of Study Habits and Attitudes (SSHA) indicate good study habits and attitudes toward learning. Here are scores for 18 first-year college students and 20%u00a0second-year college students, along with summary statistics for each group.First-year students154 109 137 115 152 140 154 178 101103 126 126 137 165 165 129 200 148Second-year students108 140 114 91 180 115 126 92 169 146109 132 75 88 113 151 70 115 187 104Group name n Mean SD Min Q1 Med Q3 MaxFirstyear18 141.06 26.436 101 126 138.5 154 200Secondyear20 121.25 32.852 70 98 114.5 143 187(a) Make parallel boxplots to compare the distributions.(b) Do these data support the belief that first-year and second-year college students differ in their study habits and attitudes toward learning? Give appropriate evidence to support your answer.22. Rating tablets In a recent year, Consumer Reportsrated many tablet computers for performance and quality. Based on several variables, the magazine gave each tablet an overall rating, where higher scores indicate better ratings. The overall ratings of the tablets produced by Apple and Samsung are given here, along with summary statistics for each group.112Apple 87 87 87 87 86 86 86 86 84 8484 84 83 83 83 83 81 79 76 73Samsung 88 87 87 86 86 86 86 86 84 84 83 8377 76 76 75 75 75 75 75 74 71 62Group name n Mean SD Min Q1 Med Q3 MaxApple 20 83.45 3.762 73 83 84 86 87Samsung 23 79.87 6.737 62 75 83 86 88(a) Make parallel boxplots to compare the distributions.(b) Based on your graphs in part (a), which company%u2019s tablet would you recommend buying? Give appropriate evidence to support your answer.Extending the Concepts23. Measuring skewness Here is a boxplot of the number of electoral votes based on the 2020 U.S. Census for each of the 50 states and the District of Columbia, along with summary statistics. You can see that the distribution is skewed to the right with 4%u00a0high outliers. How might we compute a numerical measure of skewness?%u00a9 Bedford, Freeman & Worth Publishers. For review purposes only. Do not distribute.
