
Page 51 - Demo
P. 51
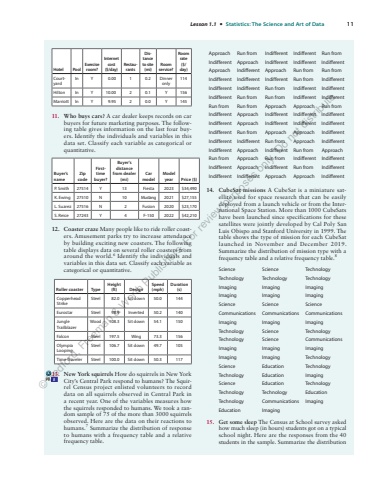
Lesson 1.1 %u2022 Statistics: The Science and Art%u00a0of Data 11Hotel Pool Exercise room? Internet cost ($/day) Restaurants Distance to site (mi) Room service? Room rate ($/day) Courtyard In Y 0.00 1 0.2 Dinner only 114 Hilton In Y 10.00 2 0.1 Y 156 Marriott In Y 9.95 2 0.0 Y 145 11. Who buys cars? A car dealer keeps records on car buyers for future marketing purposes. The following table gives information on the last four buyers. Identify the individuals and variables in this data set. Classify each variable as categorical or quantitative.Buyer%u2019s name Zip code Firsttime buyer? Buyer%u2019s distance from dealer (mi) Car model Model year Price ($) P. Smith 27514 Y 13 Fiesta 2023 $34,490 K. Ewing 27510 N 10 Mustang 2021 $27,155 L. Suarez 27516 N 2 Fusion 2020 $23,170 S. Reice 27243 Y 4 F-150 2022 $42,210 12. Coaster craze Many people like to ride roller coasters. Amusement parks try to increase attendance by building exciting new coasters. The following table displays data on several roller coasters from around the world. 6 Identify the individuals and variables in this data set. Classify each variable as categorical or quantitative.Roller coaster Type Height (ft) Design Speed (mph) Duration (s) Copperhead Strike Steel 82.0 Sit down 50.0 144 Eurostar Steel 98.9 Inverted 50.2 140 Jungle Trailblazer Wood 108.3 Sit down 54.1 150 Falcon Steel 197.5 Wing 73.3 156 Olympia Looping Steel 106.7 Sit down 49.7 105 Time Traveler Steel 100.0 Sit down 50.3 117 13. New York squirrels How do squirrels in New York City%u2019s Central Park respond to humans? The Squirrel Census project enlisted volunteers to record data on all squirrels observed in Central Park in a recent year. One of the variables measures how the squirrels responded to humans. We took a random sample of 75 of the more than 3000 squirrels observed. Here are the data on their reactions to humans. 7 Summarize the distribution of response to humans with a frequency table and a relative frequency table. Approach Run from Indifferent Indifferent Run from Indifferent Approach Indifferent Indifferent Indifferent Approach Indifferent Approach Run from Run from Indifferent Indifferent Indifferent Run from Indifferent Indifferent Indifferent Run from Indifferent Indifferent Indifferent Run from Run from Indifferent Indifferent Run from Run from Approach Approach Run from Indifferent Approach Indifferent Indifferent Indifferent Indifferent Approach Indifferent Indifferent Indifferent Indifferent Run from Approach Approach Indifferent Indifferent Indifferent Run from Approach Indifferent Indifferent Approach Indifferent Run from Approach Run from Approach Run from Indifferent Indifferent Indifferent Approach Indifferent Run from Indifferent Indifferent Indifferent Approach Approach Indifferent 14. CubeSat missions A CubeSat is a miniature satellite used for space research that can be easily deployed from a launch vehicle or from the International Space Station. More than 1000 CubeSats have been launched since specifications for these satellites were jointly developed by Cal Poly San Luis Obispo and Stanford University in 1999. The table shows the type of mission for each CubeSat launched in November and December 2019. Summarize the distribution of mission type with a frequency table and a relative frequency table. 8 Science Science Technology Technology Technology Technology Imaging Imaging Imaging Imaging Imaging Imaging Science Science Science Communications Communications Communications Imaging Imaging Imaging Technology Science Technology Technology Science Communications Imaging Imaging Imaging Imaging Imaging Technology Science Education Technology Technology Education Imaging Science Education Technology Technology Technology Education Technology Communications Imaging Education Imaging 15. Get some sleep The Census at School survey asked how much sleep (in hours) students got on a typical school night. Here are the responses from the 40 students in the sample. Summarize the distribution pg 8%u00a9 Bedford, Freeman & Worth Publishers. For review purposes only. Do not distribute.
