
Page 81 - Demo
P. 81
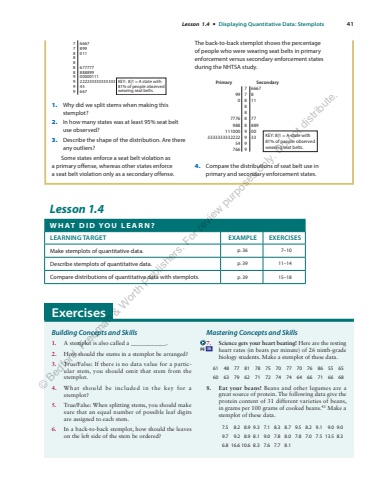
Lesson 1.4 %u2022 Displaying Quantitative Data: Stemplots 417 666789901167777788889900000111222233333333333456677888889999KEY: 8|1 = A state with81% of people observedwearing seat belts. 1. Why did we split stems when making this stemplot? 2. In how many states was at least 95% seat belt use observed? 3. Describe the shape of the distribution. Are there any outliers? Some states enforce a seat belt violation as a primary offense, whereas other states enforce a seat%u00a0belt violation only as a secondary offense. The back-to-back stemplot shows the percentage of people who were wearing seat belts in primary enforcement versus secondary enforcement states during the NHTSA study. 7788888999999077769881110003333333332222547666667811778890033Primary SecondaryKEY: 8|1 = A state with81% of people observedwearing seat belts.4. Compare the distributions of seat belt use in primary and secondary enforcement states. Lesson 1.4 W H AT D I D Y O U L E A R N ? LEARNING TARGET EXAMPLE EXERCISES Make stemplots of quantitative data. p. 36 7%u201310 Describe stemplots of quantitative data. p. 39 11%u201314 Compare distributions of quantitative data with stemplots. p. 39 15%u201318 Building Concepts and Skills 1. A stemplot is also called a ____________ . 2. How should the stems in a stemplot be arranged? 3. True/False: If there is no data value for a particular stem, you should omit that stem from the stemplot. 4. What should be included in the key for a stemplot? 5. True/False: When splitting stems, you should make sure that an equal number of possible leaf digits are assigned to each stem. 6. In a back-to-back stemplot, how should the leaves on the left side of the stem be ordered? Mastering Concepts and Skills 7. Science gets your heart beating! Here are the resting heart rates (in beats per minute) of 26%u00a0ninth-grade biology students. Make a stemplot of these data. 61 48 77 81 78 75 70 77 70 76 86 55 65 60 63 79 62 71 72 74 74 64 66 71 66 68 8. Eat your beans! Beans and other legumes are a great source of protein. The following data give the protein content of 31 different varieties of beans, in grams per 100 grams of cooked beans. 41 Make a stemplot of these data. 7.5 8.2 8.9 9.3 7.1 8.3 8.7 9.5 8.2 9.1 9.0 9.0 9.7 9.2 8.9 8.1 9.0 7.8 8.0 7.8 7.0 7.5 13.5 8.3 6.8 16.6 10.6 8.3 7.6 7.7 8.1 pg 36 Exercises %u00a9 Bedford, Freeman & Worth Publishers. For review purposes only. Do not distribute.
