
Page 75 - Demo
P. 75
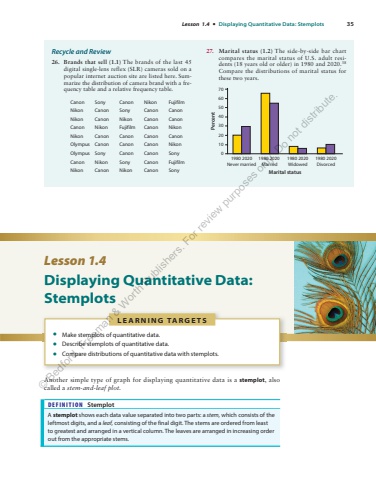
Lesson 1.4 %u2022 Displaying Quantitative Data: Stemplots 35Recycle and Review 26. Brands that sell (1.1) The brands of the last 45 digital single-lens reflex (SLR) cameras sold on a popular internet auction site are listed here. Summarize the distribution of camera brand with a frequency table and a relative frequency table. Canon Sony Canon Nikon Fujifilm Nikon Canon Sony Canon Canon Nikon Canon Nikon Canon Canon Canon Nikon Fujifilm Canon Nikon Nikon Canon Canon Canon Canon Olympus Canon Canon Canon Nikon Olympus Sony Canon Canon Sony Canon Nikon Sony Canon Fujifilm Nikon Canon Nikon Canon Sony 27. Marital status (1.2) The side-by-side bar chart compares the marital status of U.S. adult residents (18 years old or older) in 1980 and 2020. 38 Compare the distributions of marital status for these two years. Marital status706050403020100Percent1980 2020Never married1980 2020 Married1980 2020Widowed1980 2020DivorcedLesson 1.4 Displaying Quantitative Data: Stemplots L E A R N I N G TA R G E T S %u2022 Make stemplots of quantitative data. %u2022 Describe stemplots of quantitative data. %u2022 Compare distributions of quantitative data with stemplots. Another simple type of graph for displaying quantitative data is a stemplot, also called a stem-and-leaf plot . DEFINITION Stemplot A stemplot shows each data value separated into two parts: a stem, which consists of the leftmost digits, and a leaf, consisting of the final digit. The stems are ordered from least to greatest and arranged in a vertical column. The leaves are arranged in increasing order out from the appropriate stems. %u00a9 Bedford, Freeman & Worth Publishers. For review purposes only. Do not distribute.
