
Page 84 - Demo
P. 84
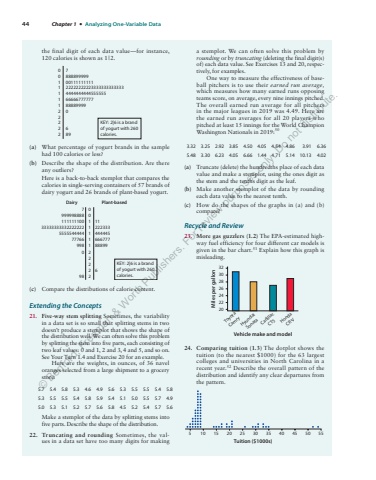
44 Chapter 1 %u2022 Analyzing One-Variable Datathe final digit of each data value%u2014for instance, 120 calories is shown as 1|2.0 700111111111222222222233333333333334444444444555555666667777778888999906890 8888999991111122222KEY: 2|6 is a brandof yogurt with 260calories.(a) What percentage of yogurt brands in the sample had 100 calories or less?(b) Describe the shape of the distribution. Are there any outliers?Here is a back-to-back stemplot that compares the calories in single-serving containers of 57 brands of dairy yogurt and 26 brands of plant-based yogurt.00111112222279999988881111111003333333333222222255555444447776699809811222333444445666777888996Dairy Plant-basedKEY: 2|6 is a brandof yogurt with 260calories.(c) Compare the distributions of calorie content.Extending the Concepts21. Five-way stem splitting Sometimes, the variability in a data set is so small that splitting stems in two doesn%u2019t produce a stemplot that shows the shape of the distribution well. We can often solve this problem by splitting the stem into five parts, each consisting of two leaf values: 0 and 1, 2 and 3, 4 and 5, and so on. See Your Turn 1.4 and Exercise 20 for an example.Here are the weights, in ounces, of 36 navel oranges selected from a large shipment to a grocery store:5.7 5.4 5.8 5.3 4.6 4.9 5.6 5.3 5.5 5.5 5.4 5.85.3 5.5 5.5 5.4 5.8 5.9 5.4 5.1 5.0 5.5 5.7 4.95.0 5.3 5.1 5.2 5.7 5.6 5.8 4.5 5.2 5.4 5.7 5.6Make a stemplot of the data by splitting stems into five parts. Describe the shape of the distribution.22. Truncating and rounding Sometimes, the values in a data set have too many digits for making a stemplot. We can often solve this problem by rounding or by truncating (deleting the final digit(s) of) each data value. See Exercises 13 and 20, respectively, for examples.One way to measure the effectiveness of baseball pitchers is to use their earned run average,which measures how many earned runs opposing teams score, on average, every nine innings pitched. The overall earned run average for all pitchers in the major leagues in 2019 was 4.49. Here are the earned run averages for all 20 players who pitched at least 15 innings for the World Champion Washington Nationals in 2019:503.32 3.25 2.92 3.85 4.50 4.05 4.54 4.86 3.91 6.365.48 3.30 6.23 4.05 6.66 1.44 4.71 5.14 10.13 4.02(a) Truncate (delete) the hundredths place of each data value and make a stemplot, using the ones digit as the stem and the tenths digit as the leaf.(b) Make another stemplot of the data by rounding each data value to the nearest tenth.(c) How do the shapes of the graphs in (a) and (b) compare?Recycle and Review23. More gas guzzlers (1.2) The EPA-estimated highway fuel efficiency for four different car models is given in the bar chart.51 Explain how this graph is misleading.32302826242220Toyota CamryHyundai SonataVehicle make and modelMiles per gallonCadillac CT5Honda CR-V24. Comparing tuition (1.3) The dotplot shows the tuition (to the nearest $1000) for the 63 largest colleges and universities in North Carolina in a recent year.52 Describe the overall pattern of the distribution and identify any clear departures from the pattern.5 10 15 20 25 30 35 40 45 50 55Tuition ($1000s)%u00a9 Bedford, Freeman & Worth Publishers. For review purposes only. Do not distribute.
