
Page 17 - 2023-bfw-APES-4e-new.indd
P. 17
the United Nations’ Millennium Ecosystem Assessment. As
part of this assessment, scientists examine trends in 24 ecosys-
tem functions that represent the four categories of ecosystem
services, including food production, fish and shellfish pro-
duction, water purification, and pollination. The trends are
examined in light of the past 50 years, as the human popula-
tion has more than doubled and caused a dramatic increase in
the consumption of ecosystem services. Of these 24 different
ecosystem functions, 15 were found to be declining or used
at a rate that cannot be sustained. In some cases, an ecosystem
function has improved, but this improvement has come at the
cost of a decline in other functions. If we want to improve
ecosystem functions, we need to improve the fate of the spe-
cies and ecosystems that provide these services.
FIGURE 9.5 A cost of increased food production. Increased
Food Production food production has led to an increase in the clearing of land.
On this farm in Brazil, the diverse rainforest was cleared for crop
Around the world, the production of food has increased faster production. (Frontpage/Shutterstock)
than the growth of the human population and this activity
has disrupted natural ecosystem services. However, there are
substantial regional differences in food production with large
increases occurring in East Asia and much smaller increases in the farming of marine fish and shellfish. You can see
occurring in sub-Saharan Africa. As we will discuss in upcom- the growth of freshwater and marine fish production in
ing modules, the reasons for the rapid growth in food produc- FIGURE 9.6 .
tion are linked to new varieties of crops, increased irrigation, The increase in wild-caught fish and shellfish is the result
and increased production of synthetic fertilizers to provide of increased fishing effort and technological advances. Com-
an additional source of fixed nitrogen for plant growth. As mercial fishing has driven down the abundances of many fish
a result, the increase in food production has caused impacts species to the point where the populations have collapsed and
on other ecosystem services. For example, as we mentioned are now too scarce to pursue. These population declines have
,
in Module 4 the rapid growth in the use of synthetic nitro- caused commercial fishing operations to shift to other species
gen has dramatically increased the amount of nitrogen
moving through terrestrial and aquatic ecosystems and
has altered the composition of species that are favored 200
in these biomes. The increase in food production has Total
also led to increased clearing of land for crops in some Capture fisheries (inland waters)
regions of the world, which results in less land contain- 150 Capture fisheries (marine waters)
ing the natural biodiversity of the region ( FIGURE 9.5 ). Aquaculture (inland waters) Aquaculture
Land clearing also results in less carbon being locked up Aquaculture (marine waters)
in the crops compared to the natural plant biomass that
was cleared, which results in more carbon dioxide going Million tonnes 100
into the atmosphere as a greenhouse gas.
50
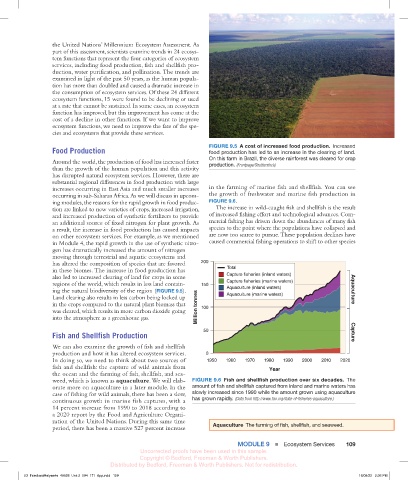
Fish and Shellfish Production Capture
We can also examine the growth of fish and shellfish
production and how it has altered ecosystem services. 0
In doing so, we need to think about two sources of 1950 1960 1970 1980 1990 2000 2010 2020
fish and shellfish: the capture of wild animals from Year
the ocean and the farming of fish, shellfish, and sea-
.
weed, which is known as aquaculture We will elab- FIGURE 9.6 Fish and shellfish production over six decades. The
orate more on aquaculture in a later module. In the amount of fish and shellfish captured from inland and marine waters has
case of fishing for wild animals, there has been a slow, slowly increased since 1990 while the amount grown using aquaculture
continuous growth in marine fish captures, with a has grown rapidly. (Data from http://www.fao.org/state-of-fisheries-aquaculture .)
14 percent increase from 1990 to 2018 according to
a 2020 report by the Food and Agriculture Organi-
zation of the United Nations. During this same time SECOND PASS
fried_es4e_09_06_0905 - February 14, 2022
period, there has been a massive 527 percent increase Aquaculture The farming of fish, shellfish, and seaweed.
ModUle 9 ■ Ecosystem Services 109
Uncorrected proofs have been used in this sample.
Copyright © Bedford, Freeman & Worth Publishers.
Distributed by Bedford, Freeman & Worth Publishers. Not for redistribution.
03_FriedlandRelyea4e_40928_Unit 2_094_171_6pp.indd 109 16/08/22 2:36 PM