
Page 21 - 2023-bfw-APES-4e-new.indd
P. 21
biogeography began with the recognition that larger islands
10-1 How does island biogeography affect which contained more species than smaller islands.
species live on islands?
Island biogeography affects the The Species-area Curve for Islands
number of species living on islands One of the most repeatable patterns in studies of biodiver-
and their ecological relationships sity is that larger islands contain more species. For example,
when researchers examined the number of amphibians and
reptiles living on islands in the West Indies, they discovered
The study of how species are distributed and interact- a plateauing relationship, as shown in FIGURE 10.1a . This
ing on islands is known as island biogeography Island
.
relationship is called the species-area curve because it is
(a) a description of how the number of species on an island
increases with the area of the island. Even more striking is
100 that when we graph the same data using log scales of both
variables, the relationship becomes a straight line, as shown
Hispaniola in Figure 10.1b .
Cuba It turns out that this relationship is quite common
75 among different types of species living on islands. For exam-
Number of species 50 Puerto Jamaica living on the islands around the Philippines, Malaysia, and
ple, when researchers examined the number of bird species
Rico
New Guinea, they once again observed a linear relationship
between island area and species richness ( FIGURE 10.2 ).
Given that the relationship is a straight line on a log scale,
25
for any line, which we typically write as:
Montserrat we can describe the relationship using the general equation
Saba
Redonda y = mx + b
0
0 20 40 60 80 100 120
Island area (thousands of km²) 1,000
(b)
100
Hispaniola Cuba Number of species (log scale) 100
Number of species (log scale) 10 Saba Montserrat 10 1
Puerto Rico
Jamaica
26
2,600
260,000
260
2,600,000
26,000
Island area (km ) (log scale)
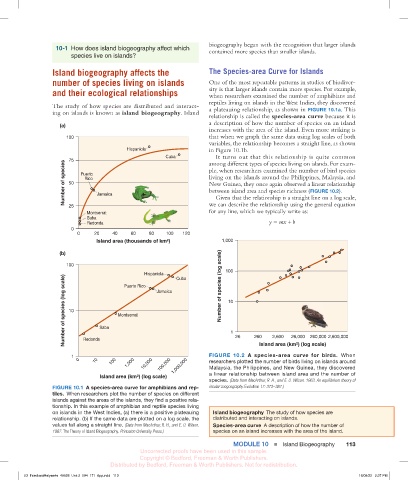
1 Redonda FIGURE 10.2 A species-area curve for birds. When
0 10 100 1,000 10,000 100,000 1,000,000 researchers plotted the number of birds living on islands around
Malaysia, the Philippines, and New Guinea, they discovered
FIRST PASS
fried_es4e_10_02_1001 - March 4, 2022
Island area (km²) (log scale) a linear relationship between island area and the number of
species. (Data from MacArthur, R. H., and E. O. Wilson. 1963. An equilibrium theory of
FIGURE 10.1 A species-area curve for amphibians and rep- insular zoogeography. Evolution 17: 373–387.)
tiles. When researchers plot the number of species on different
FIRST PASS
islands against the areas of the islands, they find a positive rela-
fried_es4e_10_01_1000 - March 1, 2022
tionship. In this example of amphibian and reptile species living
on islands in the West Indies, (a) there is a positive plateauing Island biogeography The study of how species are
relationship. (b) If the same data are plotted on a log scale, the distributed and interacting on islands.
values fall along a straight line. (Data from MacArthur, R. H., and E. O. Wilson. Species-area curve A description of how the number of
1967. The Theory of Island Biogeography . Princeton University Press.) species on an island increases with the area of the island.
ModUle 10 ■ Island Biogeography 113
Uncorrected proofs have been used in this sample.
Copyright © Bedford, Freeman & Worth Publishers.
Distributed by Bedford, Freeman & Worth Publishers. Not for redistribution.
03_FriedlandRelyea4e_40928_Unit 2_094_171_6pp.indd 113 16/08/22 2:37 PM