
Page 22 - 2023-bfw-APES-4e-new.indd
P. 22
In this case, y is the dependent variable, x is the independent a larger number of species. A wider range of environmental
variable, m is the slope, and b is the y intercept. Based on this conditions also provides greater opportunities for new spe-
equation for any line, we can write a similar equation for cies to evolve on the island over time.
the logged relationship between island area (A) and species
richness (S ):
Species-area Curves for Isolated Habitats
log S = z log A + log c in a Terrestrial Landscape
In this equation, z is the slope of the line and log c is a While scientists initially focused on oceanic islands when
constant that represents the y intercept. Using this equation, looking for relationships between island area and species rich-
researchers have examined the species-area curves for a very ness, we now know that the relationship also holds true for
diverse suite of species and they made a striking discovery. other types of isolated habitats, such as wetlands of different
The slopes of the lines all generally fall between 0.20 and sizes scattered across a terrestrial landscape. For example, when
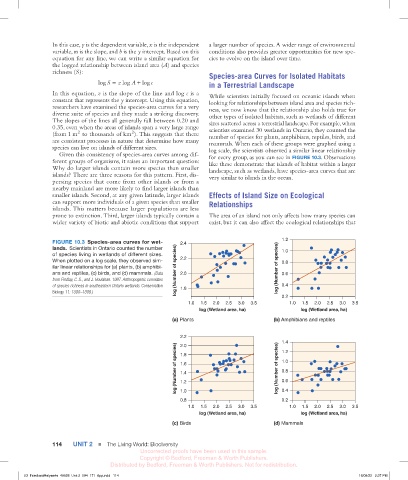
0.35, even when the areas of islands span a very large range scientists examined 30 wetlands in Ontario, they counted the
2
2
(from 1m to thousands of km ). This suggests that there number of species for plants, amphibians, reptiles, birds, and
are consistent processes in nature that determine how many mammals. When each of these groups were graphed using a
species can live on islands of different sizes. log scale, the scientists observed a similar linear relationship
Given this consistency of species-area curves among dif- for every group, as you can see in FIGURE 10.3. Observations
ferent groups of organisms, it raises an important question: like these demonstrate that islands of habitat within a larger
Why do larger islands contain more species than smaller landscape, such as wetlands, have species-area curves that are
islands? There are three reasons for this pattern. First, dis- very similar to islands in the ocean.
persing species that come from other islands or from a
nearby mainland are more likely to find larger islands than
smaller islands. Second, at any given latitude, larger islands Effects of Island Size on Ecological
can support more individuals of a given species than smaller Relationships
islands. This matters because larger populations are less
prone to extinction. Third, larger islands typically contain a The area of an island not only affects how many species can
wider variety of biotic and abiotic conditions that support exist, but it can also affect the ecological relationships that
FIGURE 10.3 Species-area curves for wet- 2.4 1.2
lands. Scientists in Ontario counted the number
of species living in wetlands of different sizes. 1.0
When plotted on a log scale, they observed sim- 2.2 0.8
ilar linear relationships for (a) plants, (b) amphibi- log (Number of species)
ans and reptiles, (c) birds, and (d) mammals. (Data log (Number of species) 2.0 0.6
from Findlay, C. S., and J. Houlahan. 1997. Anthropogenic correlates
of species richness in southeastern Ontario wetlands. Conservation 1.8 0.4
Biology 11: 1000–1009.) 0.2
1.0 1.5 2.0 2.5 3.0 3.5 1.0 1.5 2.0 2.5 3.0 3.5
log (Wetland area, ha) log (Wetland area, ha)
(a) Plants (b) Amphibians and reptiles
2.2
1.4
log (Number of species) 1.6 log (Number of species) 1.0
2.0
1.2
1.8
0.8
1.4
0.6
1.2
1.0
0.2
0.8 0.4
1.0 1.5 2.0 2.5 3.0 3.5 1.0 1.5 2.0 2.5 3.0 3.5
log (Wetland area, ha) log (Wetland area, ha)
(c) Birds (d) Mammals
114 UNIT 2 ■ The Living World: Biodiversity
Uncorrected proofs have been used in this sample.
Copyright © Bedford, Freeman & Worth Publishers.
Distributed by Bedford, Freeman & Worth Publishers. Not for redistribution.
03_FriedlandRelyea4e_40928_Unit 2_094_171_6pp.indd 114 16/08/22 2:37 PM