
Page 15 - 2023-ml-lewandowski-stats1e
P. 15
One-Tailed Tests Two-Tailed Tests
Alpha Level Alpha Level
df 0.05 0.01 0.05 0.01
8 1.860 2.897 2.306 3.356
9 1.833 2.822 2.262 3.250
10 1.813 2.764 2.228 3.170
11 1.796 2.718 2.201 3.106
12 1.783 2.681 2.179 3.055
13 1.771 2.651 2.161 3.013
14 1.762 2.625 2.145 2.977
15 1.753 2.603 2.132 2.947
16 1.746 2.584 2.120 2.921
17 1.740 2.567 2.110 2.898
18 1.734 2.553 2.101 2.879
19 1.729 2.540 2.093 2.861
20 1.725 2.528 2.086 2.846
21 1.721 2.518 2.080 2.832
22 1.717 2.509 2.074 2.819
23 1.714 2.500 2.069 2.808
24 1.711 2.492 2.064 2.797
25 1.708 2.485 2.060 2.788
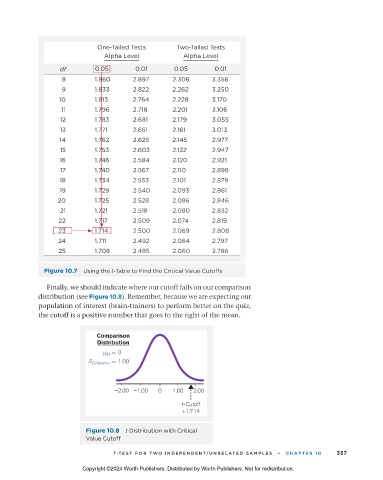
Figure 10.7 Using the t-Table to Find the Critical Value Cutoffs
Finally, we should indicate where our cutoff falls on our comparison
distribution (see Figure 10.8). Remember, because we are expecting our
population of interest (brain-trainers) to perform better on the quiz,
the cutoff is a positive number that goes to the right of the mean.
Comparison
Distribution
= 0
M
S Difference = 1.00
–2.00 –1.00 0 1.00 2.00
t-Cutoff
+1.714
Figure 10.8 t Distribution with Critical
Value Cutoff
T -TES T F OR TW O INDEPENDENT/UNRELATED S AMPLES • CHAPTER 10 357
Copyright ©2024 Worth Publishers. Distributed by Worth Publishers. Not for redistribution.
11_statsresandlife1e_24717_ch10_343_389.indd 357 29/06/23 5:17 PM