
Page 16 - 2023-ml-lewandowski-stats1e
P. 16
Step 4: Determine Sample Results At this point we have col-
lected data from both groups including whether they have engaged
in brain-training or not, and their score on the history quiz. In order
to see if there are differences between groups, we must determine the
mean quiz score for the 12 people in the brain-training group and for
the 13 people in the no brain-training group. Doing those calculations
reveals that the mean scores are 6.75 for the brain-training group and
6.00 for the no brain-training group.
Next, we want to compare our two sample’s mean to see if they are
different by subtracting them (M 1 − M 2 ). Those two number are dif-
ferent, but what we really want to know is how the difference between
those means compares to how much the differences between means
in the comparison distribution typically differ (S Difference ). These pieces
allow us to calculate our t-score, with the following formula:
t = M 1 − M 2 = 6.75 − 6.00 = 0.75 = 0.75
S Difference 1.00 1.00
M – M
1
t = S Difference 2
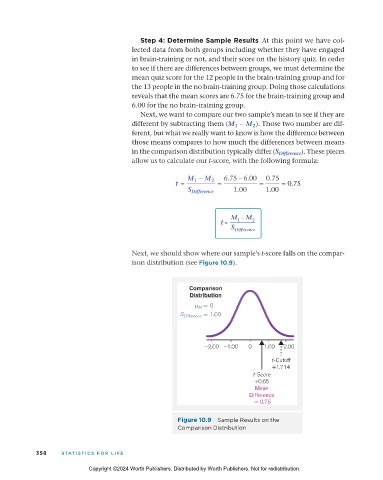
Next, we should show where our sample’s t-score falls on the compar-
ison distribution (see Figure 10.9).
Comparison
Distribution
= 0
M
S Difference = 1.00
–2.00 –1.00 0 1.00 2.00
t-Cutoff
+1.714
t-Score
+0.65
Mean
Difference
= 0.75
Figure 10.9 Sample Results on the
Comparison Distribution
358 S TATIS TI c S F OR L IFE
Copyright ©2024 Worth Publishers. Distributed by Worth Publishers. Not for redistribution.
11_statsresandlife1e_24717_ch10_343_389.indd 358 29/06/23 5:17 PM