
Page 11 - 2023-bfw-Macro-Krugman-Econ-4e
P. 11
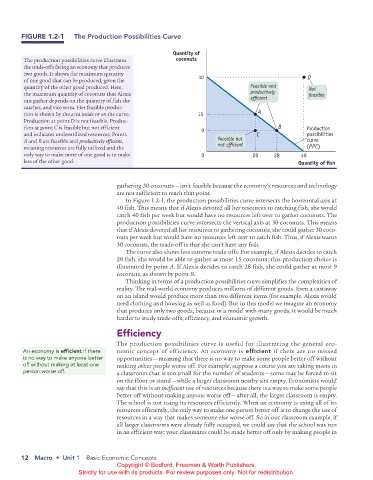
FIGURE 1.2-1    The Production Possibilities Curve


                                                                Quantity of
                The production possibilities curve illustrates   coconuts
                the trade-offs facing an economy that produces
                two goods. It shows the maximum quantity
                of one good that can be produced, given the              30                                 D
                quantity of the other good produced. Here,                                Feasible and       Not
                the maximum quantity of coconuts that Alexis                              productively       feasible
                can gather depends on the quantity of fish she                            ef cient
                catches, and vice versa. Her feasible produc-
                tion is shown by the area inside or on the curve.        15                 A
                Production at point D is not feasible. Produc-
                tion at point C is feasible but not efficient             9                        B        Production
                and indicates underutilized resources. Points                               C               possibilities
                A and B are feasible and  productively efficient,              Feasible but                 curve
                meaning resources are fully utilized and the                   not ef cient                 (PPC)
                only way to make more of one good is to make              0               20     28       40
                less of the other good.                                                                  Quantity of  sh


                                              gathering 30 coconuts — isn’t feasible because the economy’s resources and technology
                                              are not sufficient to reach that point.
                                                 In Figure 1.2-1, the production possibilities curve intersects the horizontal axis at
                                              40 fish. This means that if Alexis devoted all her resources to catching fish, she would
                                              catch 40 fish per week but would have no resources left over to gather coconuts. The
                                              production possibilities curve intersects the vertical axis at 30 coconuts. This means
                                              that if Alexis devoted all her resources to gathering coconuts, she could gather 30 coco-
                                              nuts per week but would have no resources left over to catch fish. Thus, if Alexis wants
                                              30 coconuts, the trade-off is that she can’t have any fish.
                                                 The curve also shows less extreme trade-offs. For example, if Alexis decides to catch
                                              20 fish, she would be able to gather at most 15 coconuts; this production choice is
                                              illustrated by point A. If Alexis decides to catch 28 fish, she could gather at most 9
                                              coconuts, as shown by point B.
                                                 Thinking in terms of a production possibilities curve simplifies the complexities of
                                              reality. The real-world economy produces millions of different goods. Even a castaway
                                              on an island would produce more than two different items (for example, Alexis would
                                              need clothing and housing as well as food). But in this model we imagine an economy
                                              that produces only two goods, because in a model with many goods, it would be much
                                              harder to study trade-offs, efficiency, and economic growth.

                                              Efficiency
                                              The production possibilities curve is useful for illustrating the general eco-
               An economy is efficient if there   nomic  concept of efficiency. An economy is efficient if there are no missed
               is no way to make anyone better     opportunities — meaning that there is no way to make some people better off without
               off without making at least one   making other people worse off. For example, suppose a course you are taking meets in
               person worse off.              a classroom that is too small for the number of students — some may be forced to sit
                                              on the floor or stand — while a larger classroom nearby sits empty. Economists would
                                              say that this is an inefficient use of resources because there is a way to make some people
                                              better off without making anyone worse off — after all, the larger classroom is empty.
                                              The school is not using its resources efficiently. When an economy is using all of its
                                              resources efficiently, the only way to make one person better off is to change the use of
                                              resources in a way that makes someone else worse off. So in our classroom example, if
                                              all larger classrooms were already fully occupied, we could say that the school was run
                                              in an efficient way; your classmates could be made better off only by making people in


               12  Macro  •  Unit 1  Basic Economic Concepts
                                              Copyright © Bedford, Freeman & Worth Publishers.
                                 Strictly for use with its products. For review purposes only. Not for redistribution.


          02_APKrugman4e_40932_MacroU01_002_062.indd   12                                                              05/07/22   10:50 AM