
Page 26 - 2023-bfw-Macro-Krugman-Econ-4e
P. 26
demand MODULE 1.4
In this Module, you will learn to:
• Draw a demand curve and interpret its meaning
• Define the law of demand and explain the relationship between the price of a
good or service and the quantity demanded
• Explain the difference between movements along a demand curve and changes
in demand
• Explain the determinants of demand
The most well-known economic model is the supply and demand model, and it can be The supply and demand model
used to understand how markets determine the price and quantity sold of a good or is a model of how competitive
service. Markets are made up of buyers, who demand goods and services, and sellers, markets work.
who produce them. The behavior of many different markets are well described by the
supply and demand model, which is made up of six key elements: AP ECoN TIP
®
• • The demand curve In several common
• • The set of factors that cause the demand curve to shift economics graphs, including
• • The supply curve the graph of supply and
demand, the dependent
• • The set of factors that cause the supply curve to shift
variable is on the vertical
• • The market equilibrium, which includes the equilibrium price and equilibrium quantity axis and the independent
• • The way the market equilibrium changes when the supply curve or demand curve variable is on the horizontal
shifts axis. You may have learned
the opposite convention in
To explain the supply and demand model, we will examine each of these elements in math and science classes,
turn. In this Module, we begin with the demand curve and then discuss the factors that but don’t let that confuse
cause the demand curve to shift.
you — economists go their
The Demand Curve own way.
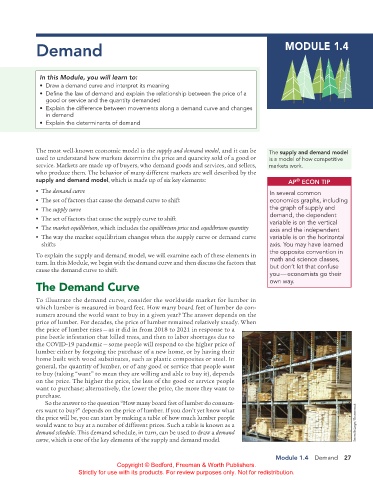
To illustrate the demand curve, consider the worldwide market for lumber in
which lumber is measured in board feet. How many board feet of lumber do con-
sumers around the world want to buy in a given year? The answer depends on the
price of lumber. For decades, the price of lumber remained relatively steady. When
the price of lumber rises — as it did in from 2018 to 2021 in response to a
pine beetle infestation that killed trees, and then to labor shortages due to
the COVID-19 pandemic — some people will respond to the higher price of
lumber either by forgoing the purchase of a new home, or by having their
home built with wood substitutes, such as plastic composites or steel. In
general, the quantity of lumber, or of any good or service that people want
to buy (taking “want” to mean they are willing and able to buy it), depends
on the price. The higher the price, the less of the good or service people
want to purchase; alternatively, the lower the price, the more they want to
purchase.
So the answer to the question “How many board feet of lumber do consum-
ers want to buy?” depends on the price of lumber. If you don’t yet know what
the price will be, you can start by making a table of how much lumber people
would want to buy at a number of different prices. Such a table is known as a Steven Belanger/Shutterstock
demand schedule. This demand schedule, in turn, can be used to draw a demand
curve, which is one of the key elements of the supply and demand model.
Module 1.4 Demand 27
Copyright © Bedford, Freeman & Worth Publishers.
Strictly for use with its products. For review purposes only. Not for redistribution.
02_APKrugman4e_40932_MacroU01_002_062.indd 27 05/07/22 10:50 AM