
Page 28 - 2023-bfw-Macro-Krugman-Econ-4e
P. 28
ModULE 1.4
is higher, reflecting a $2.00 price per board foot of lumber, compared to the number
they will sell when the price is lower, reflecting a price of only $1.00 per board foot of
lumber. When home prices are relatively high, some people will decide not to build
a new home, delay the construction of their home, build a smaller home, or use less
wood in their home. The law of demand says that a
In the real world, demand curves almost always slope downward. It is so likely higher price for a good or service,
that, all other things being equal, a higher price for a good will lead people to demand all other things being equal, leads
a smaller quantity of it, that economists are willing to call it a “law” — the law of people to demand a smaller
demand. quantity of that good or service.
Changes in factors other than price will decrease (or increase) the demand for a
®
good or service. Next, we discuss the determinants of demand — the factors that can cause AP ECoN TIP
a change in demand.
A price change causes
a change in the quantity
Shifts of the Demand Curve demanded, shown by a
movement along the demand
Even though lumber prices were higher in 2021 than they had been in 2020, the total curve. When something other
consumption of lumber was also higher in 2021 than in 2020. How can we reconcile than price causes demand to
this fact with the law of demand, which says that a higher price reduces the quantity change, it is shown as a shift of
demanded, all other things being equal? the demand curve. It is correct
The answer lies in the crucial phrase all other things being equal. In this case, all other to say that an increase in the
things weren’t equal: there were changes between 2020 and 2021 that increased the price of apples decreases the
quantity of lumber demanded at any given price. For example, the COVID-19 pan- quantity of apples demanded;
demic changed consumers’ tastes for single-family homes, as some workers could it is incorrect to say that an
work remotely and therefore didn’t need to live in cities. This change in taste led to increase in the price of apples
an increase in the quantity of lumber demanded at any given price. Figure 1.4-2 illus- decreases the demand for
trates this phenomenon using the demand schedule and demand curve for lumber. (As apples.
before, the numbers in Figure 1.4-2 are hypothetical.)
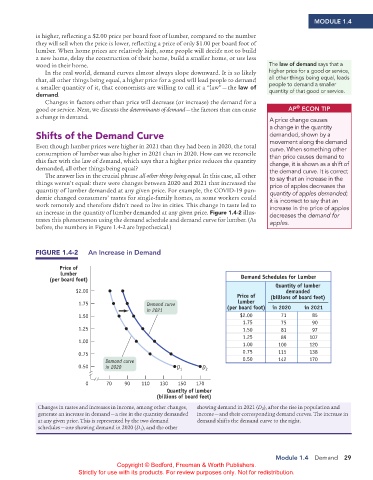
FIGURE 1.4-2 An Increase in demand
Price of
lumber
(per board foot) Demand Schedules for Lumber
Quantity of lumber
$2.00 demanded
Price of (billions of board feet)
1.75 Demand curve lumber
in 2021 (per board foot) in 2020 in 2021
1.50 $2.00 71 85
1.75 75 90
1.25 1.50 81 97
1.25 89 107
1.00
1.00 100 120
0.75 0.75 115 138
Demand curve 0.50 142 170
0.50 in 2020 D 1 D 2
0 70 90 110 130 150 170
Quantity of lumber
(billions of board feet)
Changes in tastes and increases in income, among other changes, showing demand in 2021 (D 2 ), after the rise in population and
generate an increase in demand — a rise in the quantity demanded income — and their corresponding demand curves. The increase in
at any given price. This is represented by the two demand demand shifts the demand curve to the right.
schedules — one showing demand in 2020 (D 1 ), and the other
Module 1.4 Demand 29
Copyright © Bedford, Freeman & Worth Publishers.
Strictly for use with its products. For review purposes only. Not for redistribution.
02_APKrugman4e_40932_MacroU01_002_062.indd 29 05/07/22 10:50 AM