
Page 27 - 2023-bfw-Macro-Krugman-Econ-4e
P. 27
The Demand Schedule and the Demand Curve
A demand schedule is a table A demand schedule is a table that shows how much of a good or service consumers
that shows how much of a will want to buy at different prices. On the right side of Figure 1.4-1, we show a hypo-
good or service consumers will thetical demand schedule for lumber. It’s hypothetical in that it doesn’t use actual data
be willing and able to buy at on the world demand for lumber. The demand schedule assumes that all lumber is
different prices.
standardized, although in reality there are various grades and sizes.
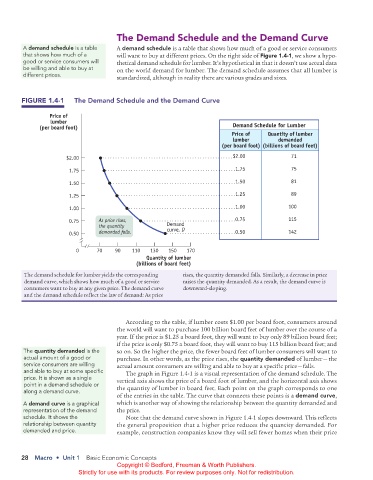
FIGURE 1.4-1 The demand Schedule and the demand Curve
Price of
lumber
(per board foot) Demand Schedule for Lumber
Price of Quantity of lumber
lumber demanded
(per board foot) (billions of board feet)
$2.00 $2.00 71
1.75 1.75 75
1.50 1.50 81
1.25 1.25 89
1.00 1.00 100
0.75 As price rises, 0.75 115
the quantity Demand
0.50 demanded falls. curve, D 0.50 142
0 70 90 110 130 150 170
Quantity of lumber
(billions of board feet)
The demand schedule for lumber yields the corresponding rises, the quantity demanded falls. Similarly, a decrease in price
demand curve, which shows how much of a good or service raises the quantity demanded. As a result, the demand curve is
consumers want to buy at any given price. The demand curve downward-sloping.
and the demand schedule reflect the law of demand: As price
According to the table, if lumber costs $1.00 per board foot, consumers around
the world will want to purchase 100 billion board feet of lumber over the course of a
year. If the price is $1.25 a board foot, they will want to buy only 89 billion board feet;
if the price is only $0.75 a board foot, they will want to buy 115 billion board feet; and
The quantity demanded is the so on. So the higher the price, the fewer board feet of lumber consumers will want to
actual amount of a good or purchase. In other words, as the price rises, the quantity demanded of lumber — the
service consumers are willing actual amount consumers are willing and able to buy at a specific price — falls.
and able to buy at some specific The graph in Figure 1.4-1 is a visual representation of the demand schedule. The
price. It is shown as a single vertical axis shows the price of a board foot of lumber, and the horizontal axis shows
point in a demand schedule or the quantity of lumber in board feet. Each point on the graph corresponds to one
along a demand curve.
of the entries in the table. The curve that connects these points is a demand curve,
A demand curve is a graphical which is another way of showing the relationship between the quantity demanded and
representation of the demand the price.
schedule. It shows the Note that the demand curve shown in Figure 1.4-1 slopes downward. This reflects
relationship between quantity the general proposition that a higher price reduces the quantity demanded. For
demanded and price. example, construction companies know they will sell fewer homes when their price
28 Macro • Unit 1 Basic Economic Concepts
Copyright © Bedford, Freeman & Worth Publishers.
Strictly for use with its products. For review purposes only. Not for redistribution.
02_APKrugman4e_40932_MacroU01_002_062.indd 28 05/07/22 10:50 AM