
Page 100 - Demo
P. 100
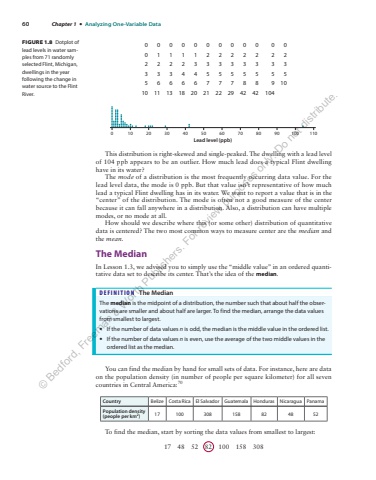
60 Chapter 1 %u2022 Analyzing One-Variable Data0 10 20 30 40 50 60 70 80 90 100 110Lead level (ppb)FIGURE 1.8 Dotplot of lead levels in water samples from 71 randomly selected Flint, Michigan, dwellings in the year following the change in water source to the Flint River.0 0 0 0 0 0 0 0 0 0 0 00 1 1 1 1 2 2 2 2 2 2 22 2 2 2 3 3 3 3 3 3 3 33 3 3 4 4 5 5 5 5 5 5 55 6 6 6 6 7 7 7 8 8 9 1010 11 13 18 20 21 22 29 42 42 104This distribution is right-skewed and single-peaked. The dwelling with a lead level of 104 ppb appears to be an outlier. How much lead does a typical Flint dwelling have in its water?The mode of a distribution is the most frequently occurring data value. For the lead level data, the mode is 0 ppb. But that value isn%u2019t representative of how much lead a typical Flint dwelling has in its water. We want to report a value that is in the %u201ccenter%u201d of the distribution. The mode is often not a good measure of the center because it can fall anywhere in a distribution. Also, a distribution can have multiple modes, or no mode at all.How should we describe where this (or some other) distribution of quantitative data is centered? The two most common ways to measure center are the median and the mean.The MedianIn Lesson 1.3, we advised you to simply use the %u201cmiddle value%u201d in an ordered quantitative data set to describe its center. That%u2019s the idea of the median.DEFINITION The MedianThe median is the midpoint of a distribution, the number such that about half the observations are smaller and about half are larger. To find the median, arrange the data values from smallest to largest.%u2022 If the number of data values n is odd, the median is the middle value in the ordered list.%u2022 If the number of data values n is even, use the average of the two middle values in the ordered list as the median.You can find the median by hand for small sets of data. For instance, here are data on the population density (in number of people per square kilometer) for all seven countries in Central America:70Country Belize Costa Rica El Salvador Guatemala Honduras Nicaragua PanamaPopulation density (people per km2) 17 100 308 158 82 48 52To find the median, start by sorting the data values from smallest to largest:17 48 52 82 100 158 308%u00a9 Bedford, Freeman & Worth Publishers. For review purposes only. Do not distribute.
