
Page 97 - Demo
P. 97
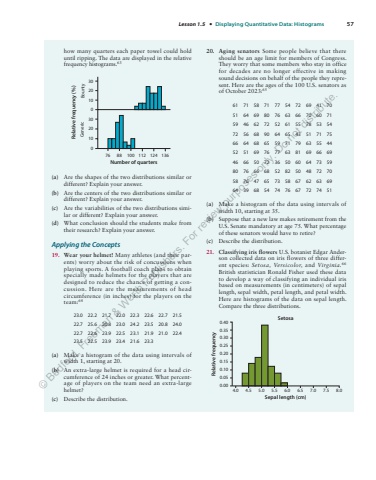
Lesson 1.5 %u2022 Displaying Quantitative Data: Histograms 57how many quarters each paper towel could hold until ripping. The data are displayed in the relative frequency histograms.63Number of quartersRelative frequency (%)Generic Bounty76 88 100 112 124 13610203001020300(a) Are the shapes of the two distributions similar or different? Explain your answer.(b) Are the centers of the two distributions similar or different? Explain your answer.(c) Are the variabilities of the two distributions similar or different? Explain your answer.(d) What conclusion should the students make from their research? Explain your answer.Applying the Concepts19. Wear your helmet! Many athletes (and their parents) worry about the risk of concussions when playing sports. A football coach plans to obtain specially made helmets for the players that are designed to reduce the chance of getting a concussion. Here are the measurements of head circumference (in inches) for the players on the team:6423.0 22.2 21.7 22.0 22.3 22.6 22.7 21.522.7 25.6 20.8 23.0 24.2 23.5 20.8 24.022.7 22.6 23.9 22.5 23.1 21.9 21.0 22.423.5 22.5 23.9 23.4 21.6 23.3(a) Make a histogram of the data using intervals of width 1, starting at 20.(b) An extra-large helmet is required for a head circumference of 24 inches or greater. What percentage of players on the team need an extra-large helmet?(c) Describe the distribution.20. Aging senators Some people believe that there should be an age limit for members of Congress. They worry that some members who stay in office for decades are no longer effective in making sound decisions on behalf of the people they represent. Here are the ages of the 100 U.S. senators as of October 2023:6561 71 58 71 77 54 72 69 41 7051 64 69 80 76 63 66 70 60 7159 46 62 72 52 61 55 78 53 5472 56 68 90 64 65 43 51 71 7566 64 68 65 59 71 79 63 55 4452 51 69 76 77 63 81 69 66 6946 66 50 72 36 50 60 64 73 5980 76 66 68 52 82 50 48 72 7058 76 47 65 73 58 67 62 63 6964 39 68 54 74 76 67 72 74 51(a) Make a histogram of the data using intervals of width 10, starting at 35.(b) Suppose that a new law makes retirement from the U.S. Senate mandatory at age 75. What percentage of these senators would have to retire?(c) Describe the distribution.21. Classifying iris flowers U.S. botanist Edgar Anderson collected data on iris flowers of three different species: Setosa, Versicolor, and Virginia.66British statistician Ronald Fisher used these data to develop a way of classifying an individual iris based on measurements (in centimeters) of sepal length, sepal width, petal length, and petal width. Here are histograms of the data on sepal length. Compare the three distributions.0.300.350.400.250.200.150.10 Relative frequencySetosa0.050.004.0 4.5 5.0 5.5 6.0 6.5 7.0 7.5 8.0Sepal length (cm)0.300.350.400.250.200.150.10VersicolorRelative frequency 0.050.004.0 4.5 5.0 5.5 6.0 6.5 7.0 7.5 8.0%u00a9 Bedford, Freeman & Worth Publishers. For review purposes only. Do not distribute.
