
Page 104 - Demo
P. 104
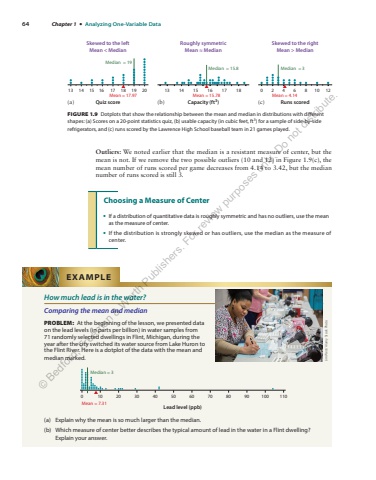
64 Chapter 1 %u2022 Analyzing One-Variable DataOutliers: We noted earlier that the median is a resistant measure of center, but the mean is not. If we remove the two possible outliers (10 and 12) in Figure 1.9(c), the mean number of runs scored per game decreases from 4.14 to 3.42, but the median number of runs scored is still 3.Choosing a Measure of Center%u2022 If a distribution of quantitative data is roughly symmetric and has no outliers, use the mean as the measure of center.%u2022 If the distribution is strongly skewed or has outliers, use the median as the measure of center.Skewed to the leftMean < MedianQuiz score Capacity (ft3) Runs scored Median = 19Median = 15.8 Median = 3Skewed to the rightMean > MedianRoughly symmetricMean %u2248 Median13 14 15 16 17 18 19 20 13 14 15 16 17 18 0246 8 10 12Mean = 17.97 Mean = 15.78 Mean = 4.14(a) (b) (c)FIGURE 1.9 Dotplots that show the relationship between the mean and median in distributions with different shapes: (a) Scores on a 20-point statistics quiz, (b) usable capacity (in cubic feet, ft3) for a sample of side-by-side refrigerators, and (c) runs scored by the Lawrence High School baseball team in 21 games played.How much lead is in the water?Comparing the mean and medianPROBLEM: At the beginning of the lesson, we presented data on the lead levels (in parts per billion) in water samples from 71 randomly selected dwellings in Flint, Michigan, during the year after the city switched its water source from Lake Huron to the Flint River. Here is a dotplot of the data with the mean and median marked.0 10 20 30Mean = 7.31Median = 340 50 60 70 80 90 100 110Lead level (ppb)(a) Explain why the mean is so much larger than the median.(b) Which measure of center better describes the typical amount of lead in the water in a Flint dwelling? Explain your answer.EXAMPLEJim West/Alamy Stock Photo%u00a9 Bedford, Freeman & Worth Publishers. For review purposes only. Do not distribute.
