
Page 102 - Demo
P. 102
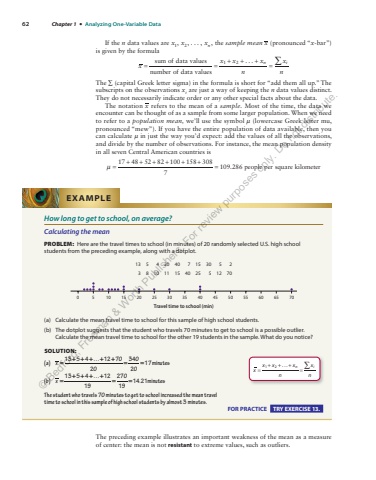
62 Chapter 1 %u2022 Analyzing One-Variable Data If the n data values are , , ... , , x x 1 2 xn the sample mean x (pronounced %u201c x -bar%u201d) is given by the formula sum of data valuesnumber of data values... 1 2xx x xnxnn %u2211 i = = + + + = The %u2211 (capital Greek letter sigma) in the formula is short for %u201cadd them all up.%u201d The subscripts on the observations xi are just a way of keeping the n data values distinct. They do not necessarily indicate order or any other special facts about the data. The notation x refers to the mean of a sample. Most of the time, the data we encounter can be thought of as a sample from some larger population. When we need to refer to a population mean, we%u2019ll use the symbol %u00b5 (lowercase Greek letter mu, pronounced %u201cmew%u201d). If you have the entire population of data available, then you can calculate %u00b5 in just the way you%u2019d expect: add the values of all the observations, and divide by the number of observations. For instance, the mean population density in all seven Central American countries is %u00b5 = + + + + + + = 17 48 52 82 100 158 3087109.286 people per square kilometer How long to get to school, on average? Calculating the mean PROBLEM: Here are the travel times to school (in minutes) of 20 randomly selected U.S. high school students from the preceding example, along with a dotplot. 13 5 4 20 40 7 15 30 5 2 3 8 10 11 15 40 25 5 12 70 25 30 605550454035Travel time to school (min)0 5 10 15 20 65 70 (a) Calculate the mean travel time to school for this sample of high school students. (b) The dotplot suggests that the student who travels 70 minutes to get to school is a possible outlier. Calculate the mean travel time to school for the other 19 students in the sample. What do you notice? SOLUTION: (a) 13 5 4 ... 12 702034020x = 17minutes+ + + + + = = (b) 13 5 4 ... 121927019x = 14.21minutes+ + + + = = The student who travels 70 minutes to get to school increased the mean%u00a0travel time to school in this sample of high school students by almost 3%u00a0minutes. EXAMPLE x x x xnxnn i ... 1 2 %u2211 = + + + =FOR PRACTICE TRY EXERCISE 13. The preceding example illustrates an important weakness of the mean as a measure of center: the mean is not resistant to extreme values, such as outliers. %u00a9 Bedford, Freeman & Worth Publishers. For review purposes only. Do not distribute.
