
Page 101 - Demo
P. 101
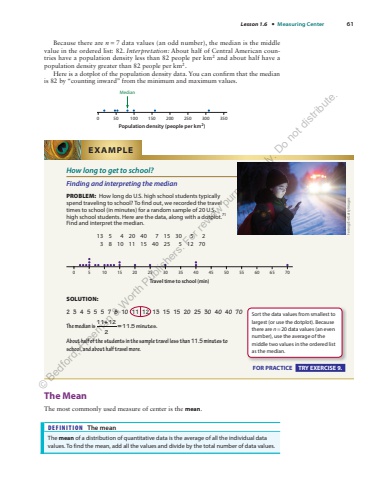
Lesson 1.6 %u2022 Measuring Center 61 Because there are n = 7 data values (an odd number), the median is the middle value in the ordered list: 82. Interpretation: About half of Central American countries have a population density less than 82 people per km2 and about half have a population density greater than 82 people per km2. Here is a dotplot of the population density data. You can confirm that the median is 82 by %u201ccounting inward%u201d from the minimum and maximum values. Population density (people per km2)0 50 100 150 200 250 300 350MedianHow long to get to school? Finding and interpreting the median PROBLEM: How long do U.S. high school students typically spend traveling to school? To find out, we recorded the travel times to school (in minutes) for a random sample of 20 U.S. high school students. Here are the data, along with a dotplot. 71 Find and interpret the median. 13 5 4 20 40 7 15 30 5 2 3 8 10 11 15 40 25 5 12 70 25 30 605550454035Travel time to school (min)0 5 10 15 20 65 70EXAMPLE Fertnig/E+/Getty ImagesSOLUTION: 2 3 4 5 5 5 7 8 10 11 12 13 15 15 20 25 30 40 40 70 The median is = 11 12 +211.5 minutes . About half of the students in the sample travel less than 11.5 minutes to school, and about half travel more. FOR PRACTICE TRY EXERCISE 9. Sort the data values from smallest to largest (or use the dotplot). Because there are n = 20 data values (an even number), use the average of the middle two values in the ordered list as the median. The Mean The most commonly used measure of center is the mean. DEFINITION The mean The mean of a distribution of quantitative data is the average of all the individual data values. To find the mean, add all the values and divide by the total number of data values. %u00a9 Bedford, Freeman & Worth Publishers. For review purposes only. Do not distribute.
