
Page 95 - Demo
P. 95
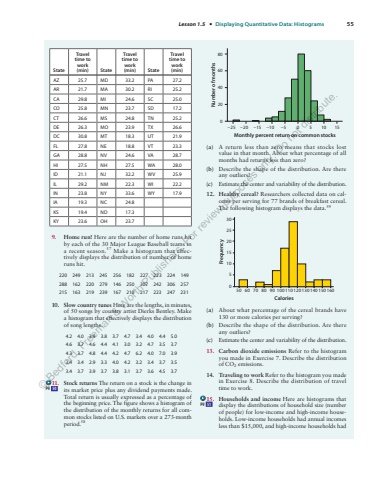
Lesson 1.5 %u2022 Displaying Quantitative Data: Histograms 55State Travel time to work (min) State Travel time to work (min) State Travel time to work (min) AZ 25.7 MD 33.2 PA 27.2 AR 21.7 MA 30.2 RI 25.2 CA 29.8 MI 24.6 SC 25.0 CO 25.8 MN 23.7 SD 17.2 CT 26.6 MS 24.8 TN 25.2 DE 26.3 MO 23.9 TX 26.6 DC 30.8 MT 18.3 UT 21.9 FL 27.8 NE 18.8 VT 23.3 GA 28.8 NV 24.6 VA 28.7 HI 27.5 NH 27.5 WA 28.0 ID 21.1 NJ 32.2 WV 25.9 IL 29.2 NM 22.3 WI 22.2 IN 23.8 NY 33.6 WY 17.9 IA 19.3 NC 24.8 KS 19.4 ND 17.3 KY 23.6 OH 23.7 9. Home run! Here are the number of home runs hit by each of the 30 Major League Baseball teams in a recent season. 57 Make a histogram that effectively displays the distribution of number of home runs hit. 220 249 213 245 256 182 227 223 224 149 288 162 220 279 146 250 307 242 306 257 215 163 219 239 167 210 217 223 247 231 10. Slow country tunes Here are the lengths, in minutes, of 50 songs by country artist Dierks Bentley. Make a histogram that effectively displays the distribution of song lengths. 4.2 4.0 3.9 3.8 3.7 4.7 3.4 4.0 4.4 5.0 4.6 3.7 4.6 4.4 4.1 3.0 3.2 4.7 3.5 3.7 4.3 3.7 4.8 4.4 4.2 4.7 6.2 4.0 7.0 3.9 3.4 3.4 2.9 3.3 4.0 4.2 3.2 3.4 3.7 3.5 3.4 3.7 3.9 3.7 3.8 3.1 3.7 3.6 4.5 3.7 11. Stock returns The return on a stock is the change in its market price plus any dividend payments made. Total return is usually expressed as a percentage of the beginning price. The figure shows a histogram of the distribution of the monthly returns for all common stocks listed on U.S. markets over a 273-month period. 58 Monthly percent return on common stocks080204060%u221225 %u221215 %u221220 %u22125%u221210 0 1 5 0 15Number of months (a) A return less than zero means that stocks lost value in that month. About what percentage of all months had returns less than zero? (b) Describe the shape of the distribution. Are there any outliers? (c) Estimate the center and variability of the distribution. 12. Healthy cereal? Researchers collected data on calories per serving for 77 brands of breakfast cereal. The following histogram displays the data. 59 5030252015105060 70 80 90 100CaloriesFrequency110 120 130 140 150 160(a) About what percentage of the cereal brands have 130 or more calories per serving? (b) Describe the shape of the distribution. Are there any outliers? (c) Estimate the center and variability of the distribution. 13. Carbon dioxide emissions Refer to the histogram you made in Exercise 7. Describe the distribution of CO2 emissions. 14. Traveling to work Refer to the histogram you made in Exercise 8. Describe the distribution of travel time to work. 15. Households and income Here are histograms that display the distributions of household size (number of people) for low-income and high-income households. Low-income households had annual incomes less than $15,000, and high-income households had pg 50pg 51%u00a9 Bedford, Freeman & Worth Publishers. For review purposes only. Do not distribute.
