
Page 106 - Demo
P. 106
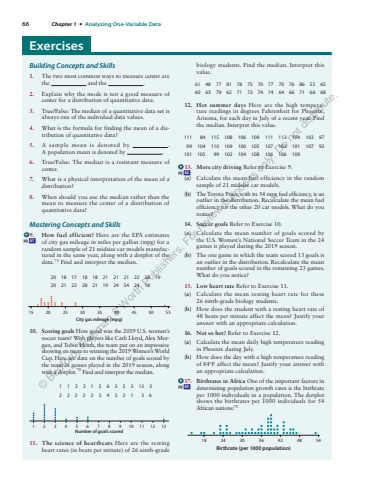
66 Chapter 1 %u2022 Analyzing One-Variable DataBuilding Concepts and Skills 1. The two most common ways to measure center are the and the . 2. Explain why the mode is not a good measure of center for a distribution of quantitative data. 3. True/False: The median of a quantitative data set is always one of the individual data values. 4. What is the formula for finding the mean of a distribution of quantitative data? 5. A sample mean is denoted by . A population mean is denoted by . 6. True/False: The median is a resistant measure of center. 7. What is a physical interpretation of the mean of a distribution? 8. When should you use the median rather than the mean to measure the center of a distribution of quantitative data? Mastering Concepts and Skills 9. How fuel efficient? Here are the EPA estimates of city gas mileage in miles per gallon (mpg) for a random sample of 21 midsize car models manufactured in the same year, along with a dotplot of the data. 73 Find and interpret the median. 20 18 17 18 18 21 21 21 22 28 19 20 21 22 28 21 19 24 54 24 18 City gas mileage (mpg)15 20 25 30 35 40 45 50 5510. Scoring goals How good was the 2019 U.S. women%u2019s soccer team? With players like Carli Lloyd, Alex Morgan, and Tobin Heath, the team put on an impressive showing en route to winning the 2019 Women%u2019s World Cup. Here are data on the number of goals scored by the team in games played in the 2019 season, along with a dotplot. 74 Find and interpret the median. 1 1 2 2 1 5 6 3 5 3 13 3 2 2 2 2 2 3 4 3 2 1 3 6 Number of goals scored1 2 3 4 5 6 7 8 9 10 11 12 1311. The science of heartbeats Here are the resting heart rates (in beats per minute) of 26 ninth-grade biology students. Find the median. Interpret this value. 61 48 77 81 78 75 70 77 70 76 86 55 65 60 63 79 62 71 72 74 74 64 66 71 66 68 12. Hot summer days Here are the high temperature readings in degrees Fahrenheit for Phoenix, Arizona, for each day in July of a recent year. Find the median. Interpret this value. 111 84 115 108 106 109 111 113 104 103 97 99 104 110 109 100 105 107 102 101 107 93 101 105 99 102 104 108 106 106 109 13. More city driving Refer to Exercise 9. (a) Calculate the mean fuel efficiency in the random sample of 21 midsize car models. (b) The Toyota Prius, with its 54 mpg fuel efficiency, is an outlier in the distribution. Recalculate the mean fuel efficiency for the other 20 car models. What do you notice? 14. Soccer goals Refer to Exercise 10. (a) Calculate the mean number of goals scored by the U.S. Women%u2019s National Soccer Team in the 24 games it played during the 2019 season. (b) The one game in which the team scored 13 goals is an outlier in the distribution. Recalculate the mean number of goals scored in the remaining 23 games. What do you notice? 15. Low heart rate Refer to Exercise 11. (a) Calculate the mean resting heart rate for these 26%u00a0ninth-grade biology students. (b) How does the student with a resting heart rate of 48 beats per minute affect the mean? Justify your answer with an appropriate calculation. 16. Not so hot? Refer to Exercise 12. (a) Calculate the mean daily high temperature reading in Phoenix during July. (b) How does the day with a high temperature reading of 84 F%u00b0 affect the mean? Justify your answer with an appropriate calculation. 17. Birthrates in Africa One of the important factors in determining population growth rates is the birthrate per 1000 individuals in a population. The dotplot shows the birthrates per 1000 individuals for 54 African nations: 75 18 24 30Birthrate (per 1000 population)36 42 48 54pg 61pg 62pg 64 Exercises %u00a9 Bedford, Freeman & Worth Publishers. For review purposes only. Do not distribute.
