
Page 87 - Demo
P. 87
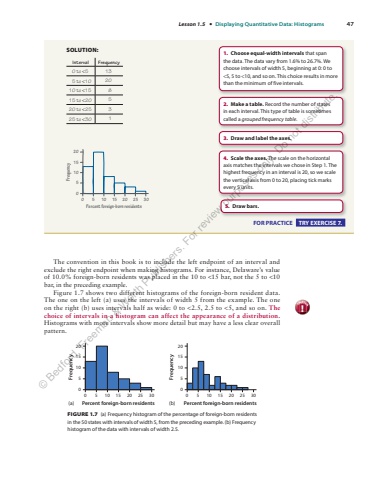
Lesson 1.5 %u2022 Displaying Quantitative Data: Histograms 47 The convention in this book is to include the left endpoint of an interval and exclude the right endpoint when making histograms. For instance, Delaware%u2019s value of 10.0% foreign-born residents was placed in the 10 to <15 bar, not the 5 to <10 bar, in the preceding example. Figure 1.7 shows two different histograms of the foreign-born resident data. The one on the left (a) uses the intervals of width 5 from the example. The one on the right (b) uses intervals half as wide: 0 to <2.5, 2.5 to <5, and so on. The choice of intervals in a histogram can affect the appearance of a distribution.Histograms with more intervals show more detail but may have a less clear overall pattern. 051015200 5 10 15 20 25 30Percent foreign-born residentsFrequency051015200 5 10 15 20 25 30Percent foreign-born residentsFrequencycaution!FIGURE 1.7 (a) Frequency histogram of the percentage of foreign-born residents in the 50 states with intervals of width 5, from the preceding example. (b) Frequency histogram of the data with intervals of width 2.5. SOLUTION: Interval Frequency 0 to <5 13 5 to <10 20 10 to <15 8 15 to <20 5 20 to <25 3 25 to <30 1 FOR PRACTICE TRY EXERCISE 7. 1. Choose equal-width intervals that span the data. The data vary from 1.6% to 26.7%. We choose intervals of width 5, beginning at 0: 0 to <5, 5 to <10, and so on. This choice results in more than the minimum of five intervals. Percent foreign-born residents1510500 5 10 15 20 25 30Frequency204. Scale the axes. The scale on the horizontal axis matches the intervals we chose in Step 1. The highest frequency in an interval is 20, so we scale the vertical axis from 0 to 20, placing tick marks every 5 units. 3. Draw and label the axes.2. Make a table. Record the number of states in each interval. This type of table is sometimes called a grouped frequency table.5. Draw bars.(a) (b) %u00a9 Bedford, Freeman & Worth Publishers. For review purposes only. Do not distribute.
