
Page 86 - Demo
P. 86
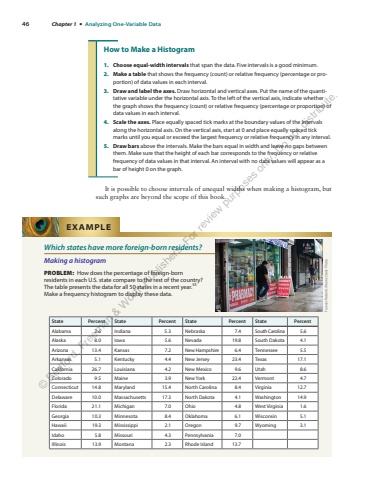
46 Chapter 1 %u2022 Analyzing One-Variable DataHow to Make a Histogram1. Choose equal-width intervals that span the data. Five intervals is a good minimum.2. Make a table that shows the frequency (count) or relative frequency (percentage or proportion) of data values in each interval.3. Draw and label the axes. Draw horizontal and vertical axes. Put the name of the quantitative variable under the horizontal axis. To the left of the vertical axis, indicate whether the graph shows the frequency (count) or relative frequency (percentage or proportion) of data values in each interval.4. Scale the axes. Place equally spaced tick marks at the boundary values of the intervals along the horizontal axis. On the vertical axis, start at 0 and place equally spaced tick marks until you equal or exceed the largest frequency or relative frequency in any interval.5. Draw bars above the intervals. Make the bars equal in width and leave no gaps between them. Make sure that the height of each bar corresponds to the frequency or relative frequency of data values in that interval. An interval with no data values will appear as a bar of height 0 on the graph.It is possible to choose intervals of unequal widths when making a histogram, but such graphs are beyond the scope of this book.Which states have more foreign-born residents?Making a histogramPROBLEM: How does the percentage of foreign-born residents in each U.S. state compare to the rest of the country? The table presents the data for all 50 states in a recent year.53Make a frequency histogram to display these data.State Percent State Percent State Percent State PercentAlabama 3.6 Indiana 5.3 Nebraska 7.4 South Carolina 5.6Alaska 8.0 Iowa 5.6 Nevada 19.8 South Dakota 4.1Arizona 13.4 Kansas 7.2 New Hampshire 6.4 Tennessee 5.5Arkansas 5.1 Kentucky 4.4 New Jersey 23.4 Texas 17.1California 26.7 Louisiana 4.2 New Mexico 9.6 Utah 8.6Colorado 9.5 Maine 3.9 New York 22.4 Vermont 4.7Connecticut 14.8 Maryland 15.4 North Carolina 8.4 Virginia 12.7Delaware 10.0 Massachusetts 17.3 North Dakota 4.1 Washington 14.9Florida 21.1 Michigan 7.0 Ohio 4.8 West Virginia 1.6Georgia 10.3 Minnesota 8.4 Oklahoma 6.1 Wisconsin 5.1Hawaii 19.3 Mississippi 2.1 Oregon 9.7 Wyoming 3.1Idaho 5.8 Missouri 4.3 Pennsylvania 7.0Illinois 13.9 Montana 2.3 Rhode Island 13.7EXAMPLEFrances Roberts/Alamy Stock Photo%u00a9 Bedford, Freeman & Worth Publishers. For review purposes only. Do not distribute.
