
Page 50 - bfw-APHG-1e
P. 50
focuses on the female segment of the population, reveals
average family size, and suggests future changes in the TERMS TO KNOW . . .
population structure. It is also a more reliable indica- replacement level fertility: The average number of
tor for making regional and national comparisons and children needed to replace both parents and stabilize
predictions. A TFR of 2.1 is replacement level fertility, population over time
or the average number of children needed to replace
both parents and stabilize the population over time. It
is slightly more than 2 because not every child survives Factors Affecting Fertility
to adulthood. A TFR of less than 2.1 in a long period of Rates
time will cause a natural decline of population because
deaths will exceed births. How many siblings do you and your friends have? How
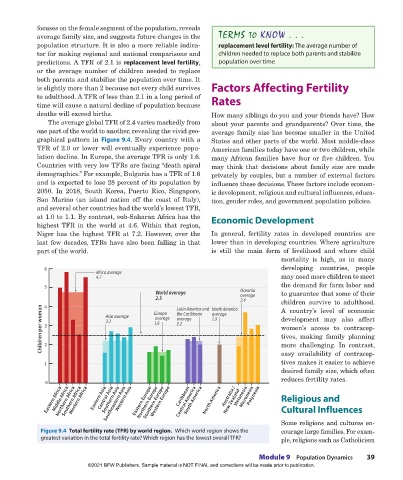
The average global TFR of 2.4 varies markedly from about your parents and grandparents? Over time, the
one part of the world to another, revealing the vivid geo- average family size has become smaller in the United
graphical pattern in Figure 9.4. Every country with a States and other parts of the world. Most middle-class
TFR of 2.0 or lower will eventually experience popu- American families today have one or two children, while
lation decline. In Europe, the average TFR is only 1.6. many African families have four or five children. You
Countries with very low TFRs are facing “death spiral may think that decisions about family size are made
demographics.” For example, Bulgaria has a TFR of 1.6 privately by couples, but a number of external factors
and is expected to lose 28 percent of its population by influence these decisions. These factors include econom-
2050. In 2018, South Korea, Puerto Rico, Singapore, ic development, religious and cultural influences, educa-
San Marino (an island nation off the coast of Italy), tion, gender roles, and government population policies.
and several other countries had the world’s lowest TFR,
at 1.0 to 1.1. By contrast, sub-Saharan Africa has the Economic Development
highest TFR in the world at 4.6. Within that region,
Niger has the highest TFR at 7.2. However, over the In general, fertility rates in developed countries are
last few decades, TFRs have also been falling in that lower than in developing countries. Where agriculture
part of the world. is still the main form of livelihood and where child
mortality is high, as in many
6 developing countries, people
Africa average
4.7 may need more children to meet
5 the demand for farm labor and
World average Oceania to guarantee that some of their
2.5 Latin America and North America average children survive to adulthood.
2.4
4
Children per woman 3 2 Asia average average the Caribbean average development may also affect
A country’s level of economic
Europe
average
1.9
2.2
1.6
2.2
women’s access to contracep-
tives, making family planning
more challenging. In contrast,
tives makes it easier to achieve
1 easy availability of contracep-
desired family size, which often
reduces fertility rates.
0
Northern Europe
Southeastern Asia
Southern Asia
Western Africa
Eastern Africa Middle Africa Southern Africa Eastern Asia Central Asia Western Asia Eastern Europe Southern Europe Caribbean South America North America Australia / Melanesia Micronesia Polynesia Religious and
Northern Africa
Western Europe
Central America
New Zealand
Cultural Influences
Some religions and cultures en-
Figure 9.4 Total fertility rate (TFR) by world region. Which world region shows the courage large families. For exam-
greatest variation in the total fertility rate? Which region has the lowest overall TFR? ple, religions such as Catholicism
Module 9 Population Dynamics 39
©2021 BFW Publishers. Sample material is NOT FINAL and corrections will be made prior to publication.
02_Hildebrhgap1e_19224_unit02_002_131_4pp.indd 39 05/19/20 6:04 PM