
Page 53 - bfw-APHG-1e
P. 53
80°N 80°N
Arctic Circle
Arctic Circle
60°N 60°N
40°N 40°N
ATLANTIC
OCEAN Tropic of Cancer
Tropic of Cancer
20°N 20°N
PACIFIC PACIFIC
OCEAN OCEAN
Equator
0° Equator 0°
Infant mortality INDIAN
rate, 2017 (deaths OCEAN
20°S per 1000 live births) 20°S
Tropic of Capricorn
Below 5 ATLANTIC Tropic of Capricorn
5–10 OCEAN
40°S 40°S
10.1–20 0 2000 4000 miles
20.1–50 0 2000 4000 km
Above 50 120°W 100°W 80°W 60°W 40°W 20°W 0° 20°E 40°E 60°E 80°E 100°E 120°E 140°E 160°E 180°
160°W
160°W
120°W
100°W
140°W
140°W
No data
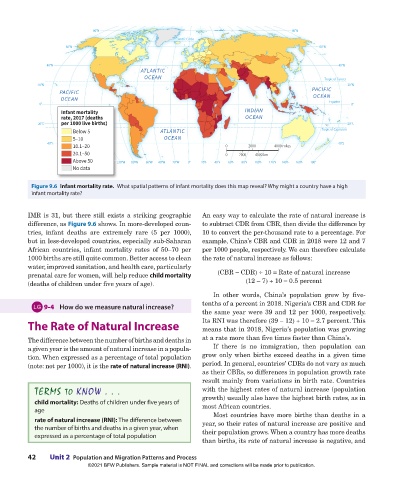
Figure 9.6 Infant mortality rate. What spatial patterns of infant mortality does this map reveal? Why might a country have a high
infant mortality rate?
IMR is 31, but there still exists a striking geographic An easy way to calculate the rate of natural increase is
difference, as Figure 9.6 shows. In more- developed coun- to subtract CDR from CBR, then divide the difference by
tries, infant deaths are extremely rare (5 per 1000), 10 to convert the per-thousand rate to a percentage. For
but in less-developed countries, especially sub-Saharan example, China’s CBR and CDR in 2018 were 12 and 7
African countries, infant mortality rates of 50–70 per per 1000 people, respectively. We can therefore calculate
1000 births are still quite common. Better access to clean the rate of natural increase as follows:
water, improved sanitation, and health care, particularly
prenatal care for women, will help reduce child mortality (CBR - CDR) ÷ 10 = Rate of natural increase
(deaths of children under five years of age). (12 - 7) ÷ 10 = 0.5 percent
In other words, China’s population grew by five-
9-4 How do we measure natural increase? tenths of a percent in 2018. Nigeria’s CBR and CDR for
the same year were 39 and 12 per 1000, respectively.
The Rate of Natural Increase Its RNI was therefor e (39 - 12) ÷ 10 = 2.7 percent. This
means that in 2018, Nigeria’s population was growing
The difference between the number of births and deaths in at a rate more than five times faster than China’s.
a given year is the amount of natural increase in a popula- If there is no immigration, then population can
tion. When expressed as a percentage of total population grow only when births exceed deaths in a given time
(note: not per 1000), it is the rate of natural increase (RNI). period. In general, countries’ CDRs do not vary as much
as their CBRs, so differences in population growth rate
result mainly from variations in birth rate. Countries
TERMS TO KNOW . . . with the highest rates of natural increase (population
child mortality: Deaths of children under five years of growth) usually also have the highest birth rates, as in
age most African countries.
Most countries have more births than deaths in a
rate of natural increase (RNI): The difference between year, so their rates of natural increase are positive and
the number of births and deaths in a given year, when
expressed as a percentage of total population their population grows. When a country has more deaths
than births, its rate of natural increase is negative, and
42 Unit 2 Population and Migration Patterns and Process
©2021 BFW Publishers. Sample material is NOT FINAL and corrections will be made prior to publication.
02_Hildebrhgap1e_19224_unit02_002_131_4pp.indd 42 05/19/20 6:04 PM