
Page 52 - bfw-APHG-1e
P. 52
80°N 80°N
Arctic Circle
Arctic Circle
60°N 60°N
40°N 40°N
ATLANTIC
OCEAN Tropic of Cancer
Tropic of Cancer
20°N 20°N
PACIFIC PACIFIC
OCEAN OCEAN
Equator
0° Equator 0°
INDIAN
Death rate, 2017 OCEAN
20°S (deaths per 1000 20°S
population) ATLANTIC Tropic of Capricorn
Tropic of Capricorn
11–15 OCEAN
40°S 9–10 0 2000 4000 miles 40°S
7–8 0 2000 4000 km
1–6 140°W 120°W 100°W 80°W 60°W 40°W 20°W 0° 20°E 40°E 60°E 80°E 100°E 120°E 140°E 160°E 180°
160°W
160°W
120°W
140°W
No data
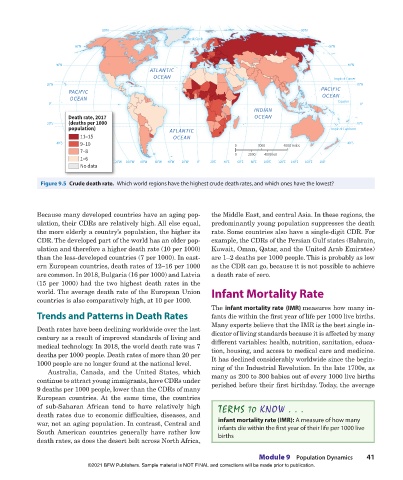
Figure 9.5 Crude death rate. Which world regions have the highest crude death rates, and which ones have the lowest?
Because many developed countries have an aging pop- the Middle East, and central Asia. In these regions, the
ulation, their CDRs are relatively high. All else equal, predominantly young population suppresses the death
the more elderly a country’s population, the higher its rate. Some countries also have a single-digit CDR. For
CDR. The developed part of the world has an older pop- example, the CDRs of the Persian Gulf states (Bahrain,
ulation and therefore a higher death rate (10 per 1000) Kuwait, Oman, Qatar, and the United Arab Emirates)
than the less-developed countries (7 per 1000). In east- are 1–2 deaths per 1000 people. This is probably as low
ern European countries, death rates of 12–16 per 1000 as the CDR can go, because it is not possible to achieve
are common. In 2018, Bulgaria (16 per 1000) and Latvia a death rate of zero.
(15 per 1000) had the two highest death rates in the
world. The average death rate of the European Union Infant Mortality Rate
countries is also comparatively high, at 10 per 1000.
The infant mortality rate (IMR) measures how many in-
Trends and Patterns in Death Rates fants die within the first year of life per 1000 live births.
Many experts believe that the IMR is the best single in-
Death rates have been declining worldwide over the last dicator of living standards because it is affected by many
century as a result of improved standards of living and different variables: health, nutrition, sanitation, educa-
medical technology. In 2018, the world death rate was 7 tion, housing, and access to medical care and medicine.
deaths per 1000 people. Death rates of more than 20 per It has declined considerably worldwide since the begin-
1000 people are no longer found at the national level. ning of the Industrial Revolution. In the late 1700s, as
Australia, Canada, and the United States, which
continue to attract young immigrants, have CDRs under many as 200 to 300 babies out of every 1000 live births
perished before their first birthday. Today, the average
9 deaths per 1000 people, lower than the CDRs of many
European countries. At the same time, the countries
of sub-Saharan African tend to have relatively high TERMS TO KNOW . . .
death rates due to economic difficulties, diseases, and
war, not an aging population. In contrast, Central and infant mortality rate (IMR): A measure of how many
infants die within the first year of their life per 1000 live
South American countries generally have rather low births
death rates, as does the desert belt across North Africa,
Module 9 Population Dynamics 41
©2021 BFW Publishers. Sample material is NOT FINAL and corrections will be made prior to publication.
02_Hildebrhgap1e_19224_unit02_002_131_4pp.indd 41 05/19/20 6:04 PM