
Page 107 - Demo
P. 107
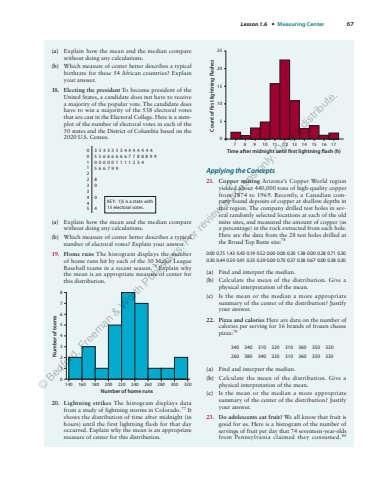
Lesson 1.6 %u2022 Measuring Center 67(a) Explain how the mean and the median compare without doing any calculations.(b) Which measure of center better describes a typical birthrate for these 54 African countries? Explain your answer.18. Electing the president To become president of the United States, a candidate does not have to receive a majority of the popular vote. The candidate does have to win a majority of the 538 electoral votes that are cast in the Electoral College. Here is a stemplot of the number of electoral votes in each of the 50 states and the District of Columbia based on the 2020 U.S. Census.0 355660580046666778 80000 16679 91112348 9 9333333444444 40112233445KEY: 1|5 is a state with15 electoral votes. (a) Explain how the mean and the median compare without doing any calculations.(b) Which measure of center better describes a typical number of electoral votes? Explain your answer.19. Home runs The histogram displays the number of home runs hit by each of the 30 Major League Baseball teams in a recent season.76 Explain why the mean is an appropriate measure of center for this distribution.Number of home runsNumber of teams140012345678160 180 200 220 240 260 280 300 32020. Lightning strikes The histogram displays data from a study of lightning storms in Colorado.77 It shows the distribution of time after midnight (in hours) until the first lightning flash for that day occurred. Explain why the mean is an appropriate measure of center for this distribution.252015105 Count of first lightning flashes 7 8 Time after midnight until first lightning flash (h)9 10 11 13 14 15 16 17 120Applying the Concepts21. Copper mining Arizona%u2019s Copper World region yielded about 440,000 tons of high-quality copper from 1874 to 1969. Recently, a Canadian company found deposits of copper at shallow depths in this region. The company drilled test holes in several randomly selected locations at each of the old mine sites, and measured the amount of copper (as a percentage) in the rock extracted from each hole. Here are the data from the 28 test holes drilled at the Broad Top Butte site:780.00 0.75 1.43 0.43 0.19 0.52 0.00 0.00 0.20 1.38 0.00 0.28 0.71 0.300.30 0.44 0.59 0.91 0.33 0.39 0.00 0.70 0.37 0.38 0.67 0.00 0.38 0.30(a) Find and interpret the median.(b) Calculate the mean of the distribution. Give a physical interpretation of the mean.(c) Is the mean or the median a more appropriate summary of the center of the distribution? Justify your answer.22. Pizza and calories Here are data on the number of calories per serving for 16 brands of frozen cheese pizza:79340 340 310 320 310 360 350 330260 380 340 320 310 360 350 330(a) Find and interpret the median.(b) Calculate the mean of the distribution. Give a physical interpretation of the mean.(c) Is the mean or the median a more appropriate summary of the center of the distribution? Justify your answer.23. Do adolescents eat fruit? We all know that fruit is good for us. Here is a histogram of the number of servings of fruit per day that 74 seventeen-year-olds from Pennsylvania claimed they consumed.80%u00a9 Bedford, Freeman & Worth Publishers. For review purposes only. Do not distribute.
