
Page 108 - Demo
P. 108
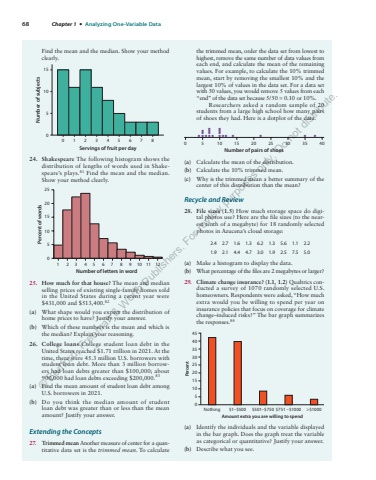
68 Chapter 1 %u2022 Analyzing One-Variable DataFind%u00a0the mean and the median. Show your method clearly.Servings of fruit per day010515Number of subjects0 1357 246 824. Shakespeare The following histogram shows the distribution of lengths of words used in Shakespeare%u2019s plays.81 Find the mean and the median. Show your method clearly.Number of letters in word0101520525Percent of words1 2468 357 9 1 10 12 125. How much for that house? The mean and median selling prices of existing single-family homes sold in the United States during a recent year were $431,000 and $513,400.82(a) What shape would you expect the distribution of home prices to have? Justify your answer.(b) Which of these numbers is the mean and which is the median? Explain your reasoning.26. College loans College student loan debt in the United States reached $1.71 trillion in 2021. At the time, there were 45.3 million U.S. borrowers with student loan debt. More than 3 million borrowers had loan debts greater than $100,000; about 900,000 had loan debts exceeding $200,000.83(a) Find the mean amount of student loan debt among U.S. borrowers in 2021.(b) Do you think the median amount of student loan debt was greater than or less than the mean amount? Justify your answer.Extending the Concepts27. Trimmed mean Another measure of center for a quantitative data set is the trimmed mean. To calculate the trimmed mean, order the data set from lowest to highest, remove the same number of data values from each end, and calculate the mean of the remaining values. For example, to calculate the 10% trimmed mean, start by removing the smallest 10% and the largest 10% of values in the data set. For a data set with 50%u00a0values, you would remove 5 values from each %u201cend%u201d of the data set because 5/50 0.10 = or 10%.Researchers asked a random sample of 20 students from a large high school how many pairs of shoes they had. Here is a dotplot of the data.0 5 10 15 20Number of pairs of shoes25 30 35 40d d d d d d d d ddd d ddd ddddd(a) Calculate the mean of the distribution.(b) Calculate the 10% trimmed mean.(c) Why is the trimmed mean a better summary of the center of this distribution than the mean?Recycle and Review28. File sizes (1.5) How much storage space do digital photos use? Here are the file sizes (to the nearest tenth of a megabyte) for 18 randomly selected photos in Azucena%u2019s cloud storage:2.4 2.7 1.6 1.3 6.2 1.3 5.6 1.1 2.21.9 2.1 4.4 4.7 3.0 1.9 2.5 7.5 5.0(a) Make a histogram to display the data.(b) What percentage of the files are 2 megabytes or larger?29. Climate change insurance? (1.1, 1.2) Qualtrics conducted a survey of 1070 randomly selected U.S. homeowners. Respondents were asked, %u201cHow much extra would you be willing to spend per year on insurance policies that focus on coverage for climate change%u2013induced risks?%u201d The bar graph summarizes the responses.844035452530201510Percent50Nothing $1%u2013$500 $501%u2013$750 $751 %u2013$1000 >$1000Amount extra you are willing to spend(a) Identify the individuals and the variable displayed in the bar graph. Does the graph treat the variable as categorical or quantitative? Justify your answer.(b) Describe what you see.%u00a9 Bedford, Freeman & Worth Publishers. For review purposes only. Do not distribute.
