
Page 109 - Demo
P. 109
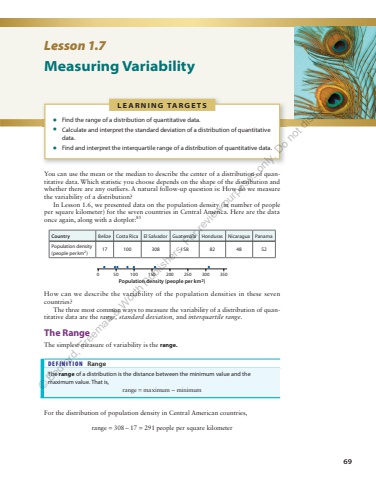
69 L E A R N I N G TA R G E T S %u2022 Find the range of a distribution of quantitative data. %u2022 Calculate and interpret the standard deviation of a distribution of quantitative data. %u2022 Find and interpret the interquartile range of a distribution of quantitative data. Lesson 1.7 Measuring Variability You can use the mean or the median to describe the center of a distribution of quantitative data. Which statistic you choose depends on the shape of the distribution and whether there are any outliers. A natural follow-up question is: How do we measure the variability of a distribution? In Lesson 1.6, we presented data on the population density (in number of people per square kilometer) for the seven countries in Central America. Here are the data once again, along with a dotplot: 85 Country Belize Costa Rica El Salvador Guatemala Honduras Nicaragua Panama Population density (people per km2 ) 17 100 308 158 82 48 52 Population density (people per km2)0 50 100 150 200 250 300 350 How can we describe the variability of the population densities in these seven countries? The three most common ways to measure the variability of a distribution of quantitative data are the range, standard deviation, and interquartile range. The Range The simplest measure of variability is the range. DEFINITION Range The range of a distribution is the distance between the minimum value and the maximum value. That is, range m= aximum %u2013 minimum For the distribution of population density in Central American countries, range = %u2212 308 17 291 peopl = e per square kilometer%u00a9 Bedford, Freeman & Worth Publishers. For review purposes only. Do not distribute.
