
Page 111 - Demo
P. 111
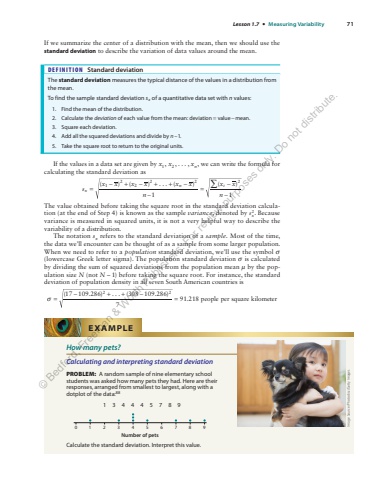
Lesson 1.7 %u2022 Measuring Variability 71If we summarize the center of a distribution with the mean, then we should use the standard deviation to describe the variation of data values around the mean.DEFINITION Standard deviationThe standard deviation measures the typical distance of the values in a distribution from the mean.To find the sample standard deviation sx of a quantitative data set with n values:1. Find the mean of the distribution.2. Calculate the deviation of each value from the mean: deviation v = %u2212 alue mean.3. Square each deviation.4. Add all the squared deviations and divide by n %u20131.5. Take the square root to return to the original units.If the values in a data set are given by , , ... , , x x 1 2 xn we can write the formula for calculating the standard deviation as%u2211 = %u2212+%u2212+ + %u2212%u2212 = %u2212%u2212( ) ( ) ... ( )1( )11222 2 2sx x x x x xnx xn xn iThe value obtained before taking the square root in the standard deviation calculation (at the end of Step 4) is known as the sample variance, denoted by 2sx. Because variance is measured in squared units, it is not a very helpful way to describe the variability of a distribution.The notation sx refers to the standard deviation of a sample. Most of the time, the data we%u2019ll encounter can be thought of as a sample from some larger population. When we need to refer to a population standard deviation, we%u2019ll use the symbol %u03c3(lowercase Greek letter sigma). The population standard deviation %u03c3 is calculated by dividing the sum of squared deviations from the population mean %u00b5 by the population size N (not N %u2013 1) before taking the square root. For instance, the standard deviation of population density in all seven South American countries is%u03c3 = %u2212 + + %u2212 = (17 109.286) ... (308 109.286)791.218 people per square kilometer2 2How many pets?Calculating and interpreting standard deviationPROBLEM: A random sample of nine elementary school students was asked how many pets they had. Here are their responses, arranged from smallest to largest, along with a dotplot of the data:881 3 4 4 4 5 7 8 9Number of pets01234 5 6 7 8 9Calculate the standard deviation. Interpret this value.EXAMPLEImage Source/Photodisc/Getty Images%u00a9 Bedford, Freeman & Worth Publishers. For review purposes only. Do not distribute.
