
Page 113 - Demo
P. 113
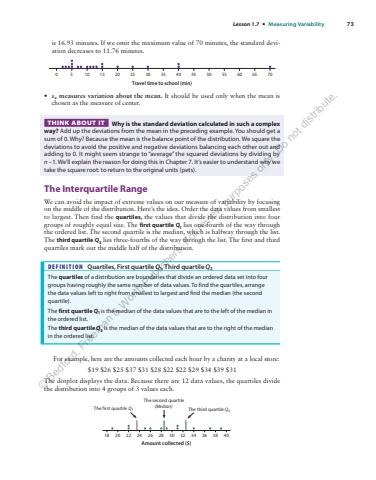
Lesson 1.7 %u2022 Measuring Variability 73is 16.93 minutes. If we omit the maximum value of 70 minutes, the standard deviation decreases to 11.76 minutes.25 30 605550454035Travel time to school (min)0 5 10 15 20 65 70%u2022 sx measures variation about the mean. It should be used only when the mean is chosen as the measure of center.THINK ABOUT IT Why is the standard deviation calculated in such a complex way? Add up the deviations from the mean in the preceding example. You should get a sum of 0. Why? Because the mean is the balance point of the distribution. We square the deviations to avoid the positive and negative deviations balancing each other out and adding to 0. It might seem strange to %u201caverage%u201d the squared deviations by dividing by n %u20131. We%u2019ll explain the reason for doing this in Chapter 7. It%u2019s easier to understand why we take the square root: to return to the original units (pets).The Interquartile RangeWe can avoid the impact of extreme values on our measure of variability by focusing on the middle of the distribution. Here%u2019s the idea. Order the data values from smallest to largest. Then find the quartiles, the values that divide the distribution into four groups of roughly equal size. The first quartile Q1 lies one-fourth of the way through the ordered list. The second quartile is the median, which is halfway through the list. The third quartile Q3 lies three-fourths of the way through the list. The first and third quartiles mark out the middle half of the distribution.DEFINITION Quartiles, First quartile Q1, Third quartile Q3The quartiles of a distribution are boundaries that divide an ordered data set into four groups having roughly the same number of data values. To find the quartiles, arrange the data values left to right from smallest to largest and find the median (the second quartile).The first quartile Q1 is the median of the data values that are to the left of the median in the ordered list.The third quartile Q3 is the median of the data values that are to the right of the median in the ordered list.For example, here are the amounts collected each hour by a charity at a local store:$19 $26 $25 $37 $31 $28 $22 $22 $29 $34 $39 $31The dotplot displays the data. Because there are 12 data values, the quartiles divide the distribution into 4 groups of 3 values each.18 20 22 24 26Amount collected ($)28 30 32 34 36 38 40The first quartile Q1The second quartile(Median) The third quartile Q3%u00a9 Bedford, Freeman & Worth Publishers. For review purposes only. Do not distribute.
