
Page 115 - Demo
P. 115
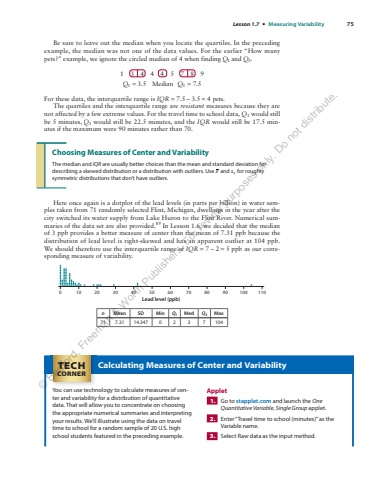
Lesson 1.7 %u2022 Measuring Variability 75 Be sure to leave out the median when you locate the quartiles. In the preceding example, the median was not one of the data values. For the earlier %u201cHow many pets?%u201d example, we ignore the circled median of 4 when finding Q1 and Q3. 1 3 4 4 4 5 7 8 9 Q1 = 3.5 Median %u00a0 7 Q3 = .5 For these data, the interquartile range is IQR = = 7.5 %u2013 3.5 4 pets. The quartiles and the interquartile range are resistant measures because they are not affected by a few extreme values. For the travel time to school data, Q1 would still be 5 minutes, Q3 would still be 22.5 minutes, and the IQR would still be 17.5%u00a0minutes if the maximum were 90 minutes rather than 70. Choosing Measures of Center and Variability The median and IQR are usually better choices than the mean and standard deviation for describing a skewed distribution or a distribution with outliers. Use x and sx for roughly symmetric distributions that don%u2019t have outliers. Here once again is a dotplot of the lead levels (in parts per billion) in water samples taken from 71 randomly selected Flint, Michigan, dwellings in the year after the city switched its water supply from Lake Huron to the Flint River. Numerical summaries of the data set are also provided. 89 In Lesson 1.6, we decided that the median of 3 ppb provides a better measure of center than the mean of 7.31 ppb because the distribution of lead level is right-skewed and has an apparent outlier at 104 ppb. We should therefore use the interquartile range of IQR = = 7 %u2013 2 5 ppb as our corresponding measure of variability. 0 10 20 30 40 50 60 70 80 90 100 110Lead level (ppb)n Mean SD Min Q1 Med Q3 Max 71 7.31 14.347 0 2 3 7 104 Calculating Measures of Center and Variability You can use technology to calculate measures of center and variability for a distribution of quantitative data. That will allow you to concentrate on choosing the appropriate numerical summaries and interpreting your results. We%u2019ll illustrate using the data on travel time to school for a random sample of 20 U.S. high school students featured in the preceding example. Applet 1. Go to stapplet.com and launch the One Quantitative Variable, Single Group applet. 2. Enter %u201cTravel time to school (minutes)%u201d as the Variable name. 3. Select Raw data as the input method. TECHCORNER %u00a9 Bedford, Freeman & Worth Publishers. For review purposes only. Do not distribute.
