
Page 114 - Demo
P. 114
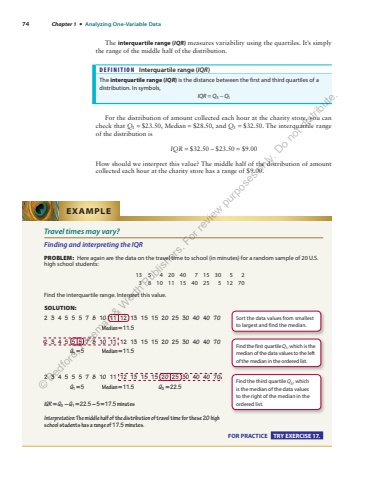
74 Chapter 1 %u2022 Analyzing One-Variable DataThe interquartile range ( IQR ) measures variability using the quartiles. It%u2019s simply the range of the middle half of the distribution. DEFINITION Interquartile range ( IQR ) The interquartile range (IQR) is the distance between the first and third quartiles of a distribution. In symbols, IQR Q= %u22123 1 Q For the distribution of amount collected each hour at the charity store, you can check that Q1 = $23.50, Median = $28.50, and Q3 = $32.50. The interquartile range of the distribution is IQR = = $32.50 %u2013 $23.50 $9.00 How should we interpret this value? The middle half of the distribution of amount collected each hour at the charity store has a range of $9.00. Travel times may vary? Finding and interpreting the IQR PROBLEM: Here again are the data on the travel time to school (in minutes) for a random sample of 20 U.S. high school students: 13 5 4 20 40 7 15 30 5 2 3 8 10 11 15 40 25 5 12 70 Find the interquartile range. Interpret this value. SOLUTION: 2 3 4 5 5 5 7 8 10 11 12 13 15 15 20 25 30 40 40 70 Median=11.5 2 3 4 5 5 5 7 8 10 11 12 13 15 15 20 25 30 40 40 70 Q1 =5 Median=11.5 2 3 4 5 5 5 7 8 10 11 12 13 15 15 20 25 30 40 40 70 Q1 =5 Median=11.5 Q3 =22.5IQR Q = %u22123 1 = Q %u2212 22.5 5%u2212 =17.5 minutesInterpretation: The middle half of the distribution of travel time for these 20 high school students has a range of 17.5 minutes. EXAMPLE Sort the data values from smallest to largest and find the median. Find the first quartile Q1 , which is the median of the data values to the left of the median in the ordered list. Find the third quartile Q3 , which is the median of the data values to the right of the median in the ordered list. FOR PRACTICE TRY EXERCISE 17. %u00a9 Bedford, Freeman & Worth Publishers. For review purposes only. Do not distribute.
