
Page 118 - Demo
P. 118
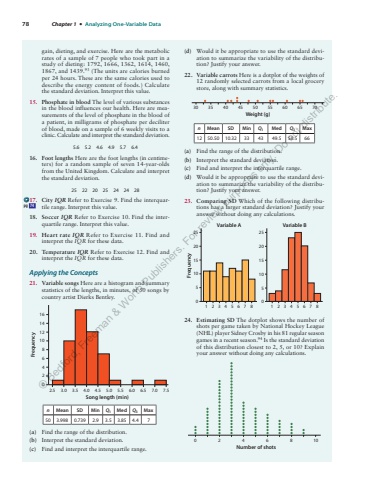
78 Chapter 1 %u2022 Analyzing One-Variable Datagain, dieting, and exercise. Here are the metabolic rates of a sample of 7 people who took part in a study of dieting: 1792, 1666, 1362, 1614, 1460, 1867, and 1439. 93 (The units are calories burned per 24 hours. These are the same calories used to describe the energy content of foods.) Calculate the standard deviation. Interpret this value. 15. Phosphate in blood The level of various substances in the blood influences our health. Here are measurements of the level of phosphate in the blood of a patient, in milligrams of phosphate per deciliter of blood, made on a sample of 6 weekly visits to a clinic. Calculate and interpret the standard deviation. 5.6 5.2 4.6 4.9 5.7 6.4 16. Foot lengths Here are the foot lengths (in centimeters) for a random sample of seven 14-year-olds from the United Kingdom. Calculate and interpret the standard deviation. 25 22 20 25 24 24 28 17. City IQR Refer to Exercise 9. Find the interquartile range. Interpret this value. 18. Soccer IQR Refer to Exercise 10. Find the interquartile range. Interpret this value. 19. Heart rate IQR Refer to Exercise 11. Find and interpret the IQR for these data. 20. Temperature IQR Refer to Exercise 12. Find and interpret the IQR for these data. Applying the Concepts 21. Variable songs Here are a histogram and summary statistics of the lengths, in minutes, of 50 songs by country artist Dierks Bentley. 12141610864Frequency202.5 3.0 3.5 4.0 4.5 5.0 5.5 6.0 6.5 7.0 7.5Song length (min)n Mean SD Min Q1 Med Q3 Max 50 3.998 0.739 2.9 3.5 3.85 4.4 7 (a) Find the range of the distribution. (b) Interpret the standard deviation. (c) Find and interpret the interquartile range. (d) Would it be appropriate to use the standard deviation to summarize the variability of the distribution? Justify your answer. 22. Variable carrots Here is a dotplot of the weights of 12 randomly selected carrots from a local grocery store, along with summary statistics. 30 35 40 45 50Weight (g)55 60 65 70n Mean SD Min Q1 Med Q3 Max 12 50.50 10.32 33 43 49.5 58.5 66 (a) Find the range of the distribution. (b) Interpret the standard deviation. (c) Find and interpret the interquartile range. (d) Would it be appropriate to use the standard deviation to summarize the variability of the distribution? Justify your answer. 23. Comparing SD Which of the following distributions has a larger standard deviation? Justify your answer without doing any calculations. 252015Frequency105012345678Variable A252015105012345678Variable B24. Estimating SD The dotplot shows the number of shots per game taken by National Hockey League (NHL) player Sidney Crosby in his 81 regular season games in a recent season. 94 Is the standard deviation of this distribution closest to 2, 5, or 10? Explain your answer without doing any calculations. Number of shots0246 8 10pg 74%u00a9 Bedford, Freeman & Worth Publishers. For review purposes only. Do not distribute.
