
Page 119 - Demo
P. 119
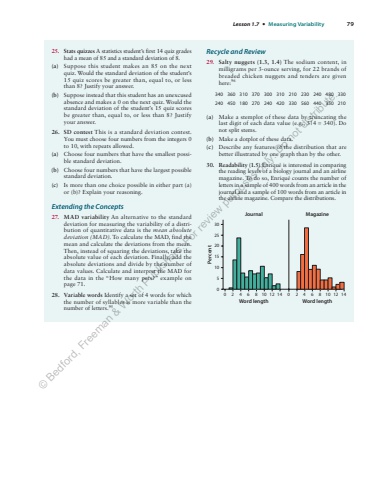
Lesson 1.7 %u2022 Measuring Variability 7925. Stats quizzes A statistics student%u2019s first 14 quiz grades had a mean of 85 and a standard deviation of 8.(a) Suppose this student makes an 85 on the next quiz. Would the standard deviation of the student%u2019s 15 quiz scores be greater than, equal to, or less than%u00a08? Justify your answer.(b) Suppose instead that this student has an unexcused absence and makes a 0 on the next quiz. Would the standard deviation of the student%u2019s 15 quiz scores be greater than, equal to, or less than 8? Justify your answer.26. SD contest This is a standard deviation contest.You must choose four numbers from the integers 0 to 10, with repeats allowed.(a) Choose four numbers that have the smallest possible standard deviation.(b) Choose four numbers that have the largest possible standard deviation.(c) Is more than one choice possible in either part (a) or (b)? Explain your reasoning.Extending the Concepts27. MAD variability An alternative to the standard deviation for measuring the variability of a distribution of quantitative data is the mean absolute deviation (MAD). To calculate the MAD, find the mean and calculate the deviations from the mean. Then, instead of squaring the deviations, take the absolute value of each deviation. Finally, add the absolute deviations and divide by the number of data values. Calculate and interpret the MAD for the data in the %u201cHow many pets?%u201d example on page 71.28. Variable words Identify a set of 4 words for which the number of syllables is more variable than the number of letters.95Recycle and Review29. Salty nuggets (1.3, 1.4) The sodium content, in milligrams per 3-ounce serving, for 22 brands of breaded chicken nuggets and tenders are given here:96340 360 310 370 300 310 210 230 240 480 330240 450 180 270 240 420 330 560 440 350 210(a) Make a stemplot of these data by truncating the last digit of each data value (e.g., 3 | 4 = 340). Do not split stems.(b) Make a dotplot of these data.(c) Describe any features of the distribution that are better illustrated by one graph than by the other.30. Readability (1.5) Enriqu%u00e9 is interested in comparing the reading levels of a biology journal and an airline magazine. To do so, Enriqu%u00e9 counts the number of letters in a sample of 400 words from an article in the journal and a sample of 100 words from an article in the airline magazine. Compare the distributions.3025201510500 2 4 6 8 10 12 14 2 0 4 6 8 10 12 14Word lengthPercentJournal MagazineWord length%u00a9 Bedford, Freeman & Worth Publishers. For review purposes only. Do not distribute.
