
Page 73 - Demo
P. 73
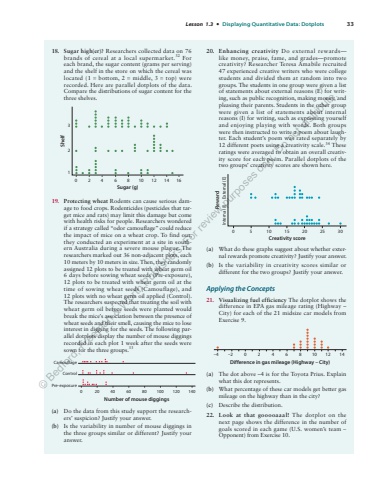
Lesson 1.3 %u2022 Displaying Quantitative Data: Dotplots 3318. Sugar high(er)? Researchers collected data on 76 brands of cereal at a local supermarket.32 For each brand, the sugar content (grams per serving) and the shelf in the store on which the cereal was located (1 = bottom, 2 = middle, 3 = top) were recorded. Here are parallel dotplots of the data. Compare the distributions of sugar content for the three shelves.10 2 4 6Sugar (g)8 10 12 14 1623Shelf19. Protecting wheat Rodents can cause serious damage to food crops. Rodenticides (pesticides that target mice and rats) may limit this damage but come with health risks for people. Researchers wondered if a strategy called %u201codor camouflage%u201d could reduce the impact of mice on a wheat crop. To find out, they conducted an experiment at a site in southern Australia during a severe mouse plague. The researchers marked out 36 non-adjacent plots, each 10 meters by 10 meters in size. Then, they randomly assigned 12 plots to be treated with wheat germ oil 6 days before sowing wheat seeds (Pre-exposure), 12 plots to be treated with wheat germ oil at the time of sowing wheat seeds (Camouflage), and 12 plots with no wheat germ oil applied (Control). The researchers suspected that treating the soil with wheat germ oil before seeds were planted would break the mice%u2019s association between the presence of wheat seeds and their smell, causing the mice to lose interest in digging for the seeds. The following parallel dotplots display the number of mouse diggings recorded in each plot 1 week after the seeds were sown for the three groups.33CamouflageControlPre-exposure0 20 40 60 80 100 120 140Number of mouse diggings(a) Do the data from this study support the researchers%u2019 suspicion? Justify your answer.(b) Is the variability in number of mouse diggings in the three groups similar or different? Justify your answer.20. Enhancing creativity Do external rewards%u2014like money, praise, fame, and grades%u2014promote creativity? Researcher Teresa Amabile recruited 47 experienced creative writers who were college students and divided them at random into two groups. The students in one group were given a list of statements about external reasons (E) for writing, such as public recognition, making money, and pleasing their parents. Students in the other group were given a list of statements about internal reasons (I) for writing, such as expressing yourself and enjoying playing with words. Both groups were then instructed to write a poem about laughter. Each student%u2019s poem was rated separately by 12 different poets using a creativity scale.34 These ratings were averaged to obtain an overall creativity score for each poem. Parallel dotplots of the two groups%u2019 creativity scores are shown here. Internal (I)Creativity scoreReward0 5 10 15 20 25 30External (E)(a) What do these graphs suggest about whether external rewards promote creativity? Justify your answer.(b) Is the variability in creativity scores similar or different for the two groups? Justify your answer.Applying the Concepts21. Visualizing fuel efficiency The dotplot shows the difference in EPA gas mileage rating (Highway %u2013City) for each of the 21 midsize car models from Exercise 9.%u20134 %u20132 0 2 4 6 8 10 12 14Difference in gas mileage (Highway %u2013 City)(a) The dot above %u20134 is for the Toyota Prius. Explain what this dot represents.(b) What percentage of these car models get better gas mileage on the highway than in the city?(c) Describe the distribution.22. Look at that gooooaaal! The dotplot on the next page shows the difference in the number of goals scored in each game (U.S. women%u2019s team %u2212Opponent) from Exercise 10.%u00a9 Bedford, Freeman & Worth Publishers. For review purposes only. Do not distribute.
