
Page 72 - Demo
P. 72
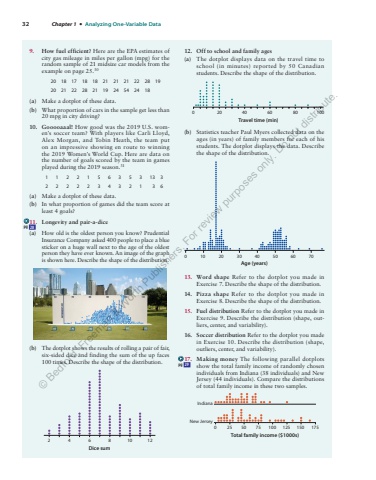
32 Chapter 1 %u2022 Analyzing One-Variable Data9. How fuel efficient? Here are the EPA estimates of city gas mileage in miles per gallon (mpg) for the random sample of 21 midsize car models from the example on page 25 . 30 20 18 17 18 18 21 21 21 22 28 19 20 21 22 28 21 19 24 54 24 18 (a) Make a dotplot of these data. (b) What proportion of cars in the sample get less than 20 mpg in city driving? 10. Gooooaaal! How good was the 2019 U.S. women%u2019s soccer team? With players like Carli Lloyd, Alex Morgan, and Tobin Heath, the team put on an impressive showing en route to winning the 2019 Women%u2019s World Cup. Here are data on the number of goals scored by the team in games played during the 2019 season. 31 1 1 2 2 1 5 6 3 5 3 13 3 2 2 2 2 2 3 4 3 2 1 3 6 (a) Make a dotplot of these data. (b) In what proportion of games did the team score at least 4 goals? 11. Longevity and pair-a-dice (a) How old is the oldest person you know? Prudential Insurance Company asked 400 people to place a blue sticker on a huge wall next to the age of the oldest person they have ever known. An image of the graph is shown here. Describe the shape of the distribution. (b) The dotplot shows the results of rolling a pair of fair, six-sided dice and finding the sum of the up faces 100 times. Describe the shape of the distribution. Dice sum2 468 10 1212. Off to school and family ages (a) The dotplot displays data on the travel time to school (in minutes) reported by 50 Canadian students. Describe the shape of the distribution. 0 20 40Travel time (min)60 80 100(b) Statistics teacher Paul Myers collected data on the ages (in years) of family members for each of his students. The dotplot displays the data. Describe the shape of the distribution. Age (years)0 10 20 30 40 50 60 7013. Word shape Refer to the dotplot you made in Exercise 7. Describe the shape of the distribution. 14. Pizza shape Refer to the dotplot you made in Exercise 8. Describe the shape of the distribution. 15. Fuel distribution Refer to the dotplot you made in Exercise 9. Describe the distribution (shape, outliers, center, and variability). 16. Soccer distribution Refer to the dotplot you made in Exercise 10. Describe the distribution (shape, outliers, center, and variability). 17. Making money The following parallel dotplots show the total family income of randomly chosen individuals from Indiana (38 individuals) and New Jersey (44 individuals). Compare the distributions of total family income in these two samples. IndianaNew Jersey0 25 50 75Total family income ($1000s)100 125 150 175pg 28pg 29%u00a9 Bedford, Freeman & Worth Publishers. For review purposes only. Do not distribute.
