
Page 74 - Demo
P. 74
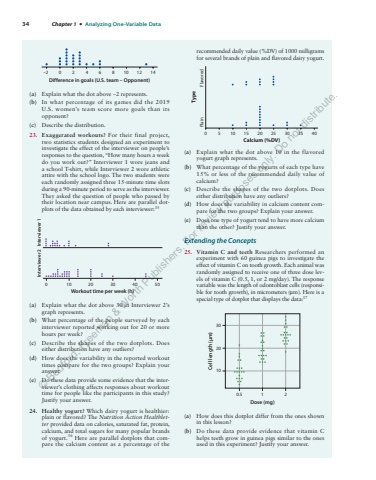
34 Chapter 1 %u2022 Analyzing One-Variable Data%u20132 0246 8 10 12 14Difference in goals (U.S. team %u2013 Opponent)(a) Explain what the dot above %u22122 represents.(b) In what percentage of its games did the 2019 U.S. women%u2019s team score more goals than its opponent?(c) Describe the distribution.23. Exaggerated workouts? For their final project, two statistics students designed an experiment to investigate the effect of the interviewer on people%u2019s responses to the question, %u201cHow many hours a week do you work out?%u201d Interviewer 1 wore jeans and a school T-shirt, while Interviewer 2 wore athletic attire with the school logo. The two students were each randomly assigned three 15-minute time slots during a 90-minute period to serve as the interviewer. They asked the question of people who passed by their location near campus. Here are parallel dotplots of the data obtained by each interviewer:35Workout time per week (h)Interviewer 2 Interviewer 10 10 20 30 40 50(a) Explain what the dot above 30 in Interviewer 2%u2019s graph represents.(b) What percentage of the people surveyed by each interviewer reported working out for 20 or more hours per week?(c) Describe the shapes of the two dotplots. Does either distribution have any outliers?(d) How does the variability in the reported workout times compare for the two groups? Explain your answer.(e) Do these data provide some evidence that the interviewer%u2019s clothing affects responses about workout time for people like the participants in this study? Justify your answer.24. Healthy yogurt? Which dairy yogurt is healthier: plain or flavored? The Nutrition Action Healthletter provided data on calories, saturated fat, protein, calcium, and total sugars for many popular brands of yogurt.36 Here are parallel dotplots that compare the calcium content as a percentage of the recommended daily value (%DV) of 1000 milligrams for several brands of plain and flavored dairy yogurt.TypeCalcium (%DV)0 5 10Plain Flavored15 20 25 30 35 40(a) Explain what the dot above 10 in the flavored yogurt graph represents.(b) What percentage of the yogurts of each type have 15% or less of the recommended daily value of calcium?(c) Describe the shapes of the two dotplots. Does either distribution have any outliers?(d) How does the variability in calcium content compare for the two groups? Explain your answer.(e) Does one type of yogurt tend to have more calcium than the other? Justify your answer.Extending the Concepts25. Vitamin C and teeth Researchers performed an experiment with 60 guinea pigs to investigate the effect of vitamin C on tooth growth. Each animal was randomly assigned to receive one of three dose levels of vitamin C (0.5, 1, or 2 mg/day). The response variable was the length of odontoblast cells (responsible for tooth growth), in micrometers (%u00b5m). Here is a special type of dotplot that displays the data:37Dose (mg)Cell length (%u00b5m)0.51020301 2(a) How does this dotplot differ from the ones shown in this lesson?(b) Do these data provide evidence that vitamin C helps teeth grow in guinea pigs similar to the ones used in this experiment? Justify your answer.%u00a9 Bedford, Freeman & Worth Publishers. For review purposes only. Do not distribute.
