
Page 92 - Demo
P. 92
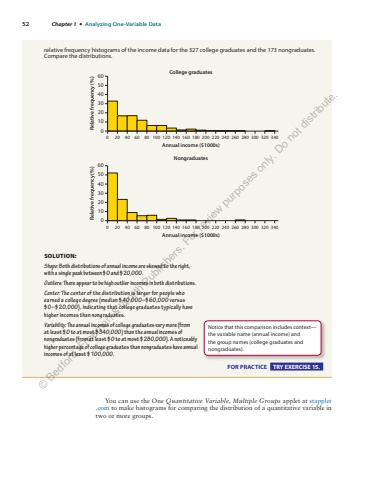
52 Chapter 1 %u2022 Analyzing One-Variable Datarelative frequency histograms of the income data for the 327 college graduates and the 173 nongraduates. Compare%u00a0the distributions. 1020304050600 20 40 60 80 100 120 140 160 180 200 220 240 260 280 300 320 340Annual income ($1000s)0 20 40 60 80 100 120 140 160 180 200 220 240 260 280 300 320 340Annual income ($1000s)College graduatesNongraduatesRelative frequency (%) Relative frequency (%) 10002030405060SOLUTION: Shape: Both distributions of annual income are skewed to the right, with a single peak between $0 and $20,000. Outliers: There appear to be high outlier incomes in both distributions. Center: The center of the distribution is larger for people who earned a college degree (median $40,000%u2013$60,000 versus $0%u2013$20,000), indicating that college graduates typically have higher incomes than nongraduates. Variability: The annual incomes of college graduates vary more (from at least $0 to at most $340,000) than the annual incomes of nongraduates (from at least $0 to at most $280,000). A noticeably higher percentage of college graduates than nongraduates have annual incomes of at least $100,000. FOR PRACTICE TRY EXERCISE 15. Notice that this comparison includes context%u2014the variable name (annual income) and the group names (college graduates and nongraduates). You can use the One Quantitative Variable, Multiple Groups applet at stapplet.com to make histograms for comparing the distribution of a quantitative variable in two or more groups. %u00a9 Bedford, Freeman & Worth Publishers. For review purposes only. Do not distribute.
