
Page 89 - Demo
P. 89
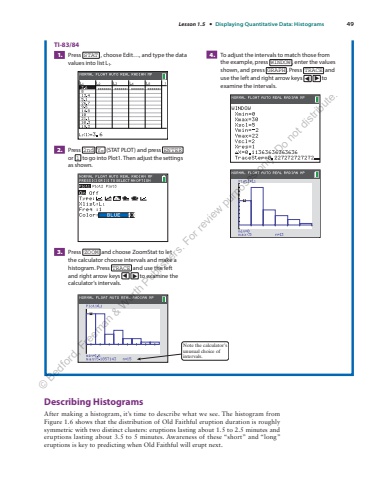
Lesson 1.5 %u2022 Displaying Quantitative Data: Histograms 49Describing HistogramsAfter making a histogram, it%u2019s time to describe what we see. The histogram from Figure 1.6 shows that the distribution of Old Faithful eruption duration is roughly symmetric with two distinct clusters: eruptions lasting about 1.5 to 2.5 minutes and eruptions lasting about 3.5 to 5 minutes. Awareness of these %u201cshort%u201d and %u201clong%u201d eruptions is key to predicting when Old Faithful will erupt next.TI-83/841. Press STAT , choose Edit%u2026, and type the data values into list L1.2. Press 2nd Y= (STAT PLOT) and press ENTER or 1 to go into Plot1. Then adjust the settings as%u00a0shown.3. Press ZOOM and choose ZoomStat to let the calculator choose intervals and make a histogram. Press TRACE and use the left and right arrow keys %u25bc%u25bc to examine the calculator%u2019s intervals.4. To adjust the intervals to match those from the example, press WINDOW , enter the values shown, and press GRAPH . Press TRACE and use the left and right arrow keys %u25bc%u25bc to examine the intervals.Note the calculator%u2019sunusual choice ofintervals.%u00a9 Bedford, Freeman & Worth Publishers. For review purposes only. Do not distribute.
