
Page 93 - Demo
P. 93
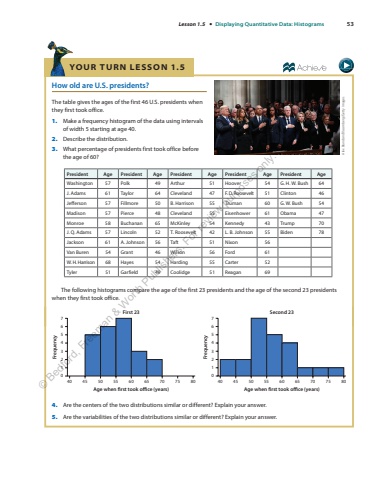
Lesson 1.5 %u2022 Displaying Quantitative Data: Histograms 53 YO U R TU R N LE SSO N 1. 5 How old are U.S. presidents? The table gives the ages of the first 46 U.S. presidents when they first took office. 1. Make a frequency histogram of the data using intervals of width 5 starting at age 40. 2. Describe the distribution. 3. What percentage of presidents first took office before the age of 60?President Age President Age President Age President Age President Age Washington 57 Polk 49 Arthur 51 Hoover 54 G. H. W. Bush 64 J. Adams 61 Taylor 64 Cleveland 47 F. D. Roosevelt 51 Clinton 46 Jefferson 57 Fillmore 50 B. Harrison 55 Truman 60 G. W. Bush 54 Madison 57 Pierce 48 Cleveland 55 Eisenhower 61 Obama 47 Monroe 58 Buchanan 65 McKinley 54 Kennedy 43 Trump 70 J. Q. Adams 57 Lincoln 52 T. Roosevelt 42 L. B. Johnson 55 Biden 78 Jackson 61 A. Johnson 56 Taft 51 Nixon 56 Van Buren 54 Grant 46 Wilson 56 Ford 61 W. H. Harrison 68 Hayes 54 Harding 55 Carter 52 Tyler 51 Garfield 49 Coolidge 51 Reagan 69 The following histograms compare the age of the first 23 presidents and the age of the second 23%u00a0 presidents when they first took office. 4567321040 45 50 55 60 65 70 75 80FrequencyAge when first took offce (years) Age when first took offce (years)4567321040 45 50 55 60 65 70 75 80FrequencyFirst 23 Second 234. Are the centers of the two distributions similar or different? Explain your answer. 5. Are the variabilities of the two distributions similar or different? Explain your answer. Alex Brandon/Bloomberg/Getty Images%u00a9 Bedford, Freeman & Worth Publishers. For review purposes only. Do not distribute.
