
Page 90 - Demo
P. 90
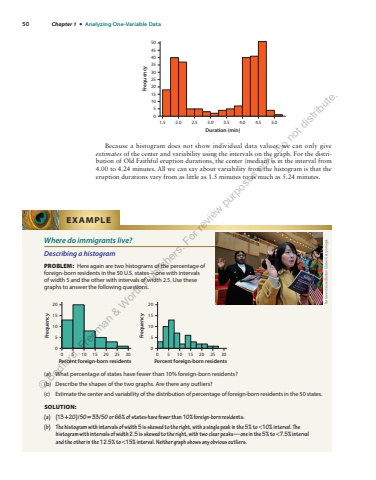
50 Chapter 1 %u2022 Analyzing One-Variable Data1.5051015202530354045502.0 2.5 3.0 3.5 4.0 4.5 5.0Duration (min)FrequencyBecause a histogram does not show individual data values, we can only give estimates of the center and variability using the intervals on the graph. For the distribution of Old Faithful eruption durations, the center (median) is in the interval from 4.00 to 4.24 minutes. All we can say about variability from the histogram is that the eruption durations vary from as little as 1.5 minutes to as much as 5.24 minutes.Where do immigrants live?Describing a histogramPROBLEM: Here again are two histograms of the percentage of foreign-born residents in the 50 U.S. states%u2014one with intervals of width 5 and the other with intervals of width 2.5. Use these graphs to answer the following questions.051015200 5 10 15 20 25 30Percent foreign-born residentsFrequency051015200 5 10 15 20 25 30Percent foreign-born residentsFrequency(a) What percentage of states have fewer than 10% foreign-born residents?(b) Describe the shapes of the two graphs. Are there any outliers?(c) Estimate the center and variability of the distribution of percentage of foreign-born residents in the 50 states.SOLUTION:(a) (13 2+ = 0)/50 3= 3/50 or 66% of states have fewer than 10% foreign-born residents.(b) The histogram with intervals of width 5 is skewed to the right, with a single peak in the 5% to <10% interval. The histogram with intervals of width 2.5 is skewed to the right, with two clear peaks%u2014one in the 5% to <7.5% interval and the other in the 12.5% to <15% interval. Neither graph shows any obvious outliers.EXAMPLEPat Greenhouse/Boston Globe/Getty Images%u00a9 Bedford, Freeman & Worth Publishers. For review purposes only. Do not distribute.
