
Page 91 - Demo
P. 91
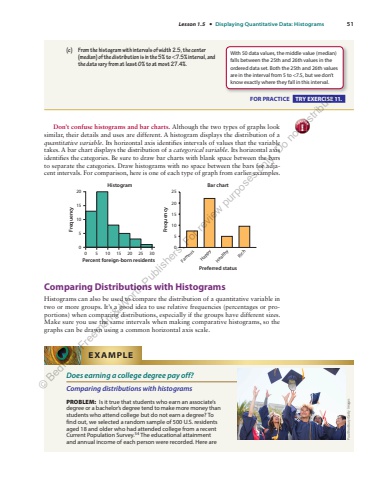
Lesson 1.5 %u2022 Displaying Quantitative Data: Histograms 51Don%u2019t confuse histograms and bar charts. Although the two types of graphs look similar, their details and uses are different. A histogram displays the distribution of a quantitative variable. Its horizontal axis identifies intervals of values that the variable takes. A bar chart displays the distribution of a categorical variable. Its horizontal axis identifies the categories. Be sure to draw bar charts with blank space between the bars to separate the categories. Draw histograms with no space between the bars for adjacent intervals. For comparison, here is one of each type of graph from earlier examples. 051015200 5 10 15 20 25 30Percent foreign-born residentsHistogramFrequencyPreferred statusFamousHappyHealthyRich0510152025FrequencyBar chart Comparing Distributions with Histograms Histograms can also be used to compare the distribution of a quantitative variable in two or more groups. It%u2019s a good idea to use relative frequencies (percentages or proportions) when comparing distributions, especially if the groups have different sizes. Make sure you use the same intervals when making comparative histograms, so the graphs can be drawn using a common horizontal axis scale. caution! (c) From the histogram with intervals of width 2.5, the center (median) of the distribution is in the 5% to <7.5% interval, and the data vary from at least 0% to at most 27.4%. FOR PRACTICE TRY EXERCISE 11. With 50 data values, the middle value (median) falls between the 25th and 26th values in the ordered data set. Both the 25th and 26th values are in the interval from 5 to <7.5, but we don%u2019t know exactly where they fall in this interval. Does earning a college degree pay off? Comparing distributions with histograms PROBLEM: Is it true that students who earn an associate%u2019s degree or a bachelor%u2019s degree tend to make more money than students who attend college but do not earn a degree? To find out, we selected a random sample of 500 U.S. residents aged 18 and older who had attended college from a recent Current Population Survey. 54 The educational attainment and annual income of each person were recorded. Here are EXAMPLE Paul Bradbury/Getty Images%u00a9 Bedford, Freeman & Worth Publishers. For review purposes only. Do not distribute.
