
Page 122 - Demo
P. 122
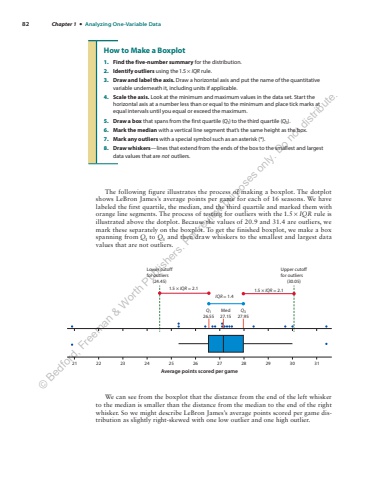
82 Chapter 1 %u2022 Analyzing One-Variable DataThe following figure illustrates the process of making a boxplot. The dotplot shows LeBron James%u2019s average points per game for each of 16 seasons. We have labeled the first quartile, the median, and the third quartile and marked them with orange line segments. The process of testing for outliers with the 1.5 %u00d7 IQR rule is illustrated above the dotplot. Because the values of 20.9 and 31.4 are outliers, we mark these separately on the boxplot. To get the finished boxplot, we make a box spanning from Q1 to Q3 and then draw whiskers to the smallest and largest data values that are not%u00a0outliers.Med27.151.5 %u00d7 IQR = 2.1 Q126.55Q327.951.5 %u00d7 IQR = 2.1 IQR = 1.4Lower cutofffor outliers(24.45)Upper cutofffor outliers(30.05)Average points scored per game21 22 23 24 25 26 27 28 29 30 31How to Make a Boxplot1. Find the five-number summary for the distribution.2. Identify outliers using the 1.5 %u00d7 IQR rule.3. Draw and label the axis. Draw a horizontal axis and put the name of the quantitative variable underneath it, including units if applicable.4. Scale the axis. Look at the minimum and maximum values in the data set. Start the horizontal axis at a number less than or equal to the minimum and place tick marks at equal intervals until you equal or exceed the maximum.5. Draw a box that spans from the first quartile (Q1) to the third quartile (Q3).6. Mark the median with a vertical line segment that%u2019s the same height as the box.7. Mark any outliers with a special symbol such as an asterisk (*).8. Draw whiskers%u2014lines that extend from the ends of the box to the smallest and largest data values that are not outliers.We can see from the boxplot that the distance from the end of the left whisker to the median is smaller than the distance from the median to the end of the right whisker. So we might describe LeBron James%u2019s average points scored per game distribution as slightly right-skewed with one low outlier and one high outlier.%u00a9 Bedford, Freeman & Worth Publishers. For review purposes only. Do not distribute.
