
Page 120 - Demo
P. 120
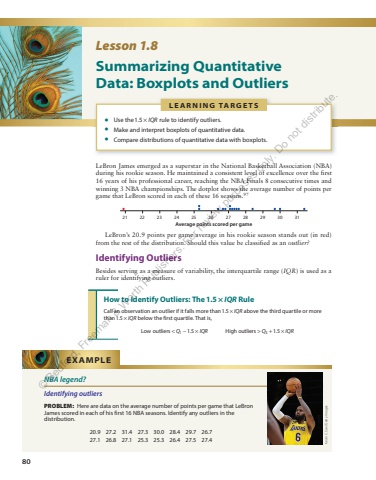
80Lesson 1.8 Summarizing Quantitative Data: Boxplots and Outliers L E A R N I N G TA R G E T S %u2022 Use the 1.5 %u00d7 IQR rule to identify outliers. %u2022 Make and interpret boxplots of quantitative data. %u2022 Compare distributions of quantitative data with boxplots. LeBron James emerged as a superstar in the National Basketball Association (NBA) during his rookie season. He maintained a consistent level of excellence over the first 16 years of his professional career, reaching the NBA Finals 8 consecutive times and winning 3 NBA championships. The dotplot shows the average number of points per game that LeBron scored in each of these 16 seasons. 97 Average points scored per game21 22 23 24 25 26 27 28 29 30 31 LeBron%u2019s 20.9 points per game average in his rookie season stands out (in red) from the rest of the distribution. Should this value be classified as an outlier? Identifying Outliers Besides serving as a measure of variability, the interquartile range ( IQR ) is used as a ruler for identifying outliers. How to Identify Outliers: The 1.5 %u00d7 IQR Rule Call an observation an outlier if it falls more than 1.5 %u00d7 IQR above the third quartile or more than 1.5 %u00d7 IQR below the first quartile. That is, Low outliers 1 < %u2212 Q I 1 .5 %u00d7 QR High outliers 1. > + Q I 3 5 %u00d7 QRNBA legend? Identifying outliers PROBLEM: Here are data on the average number of points per game that LeBron James scored in each of his first 16 NBA seasons. Identify any outliers in the distribution. 20.9 27.2 31.4 27.3 30.0 28.4 29.7 26.7 27.1 26.8 27.1 25.3 25.3 26.4 27.5 27.4 EXAMPLE Kevin C. Cox/Getty Images%u00a9 Bedford, Freeman & Worth Publishers. For review purposes only. Do not distribute.
