
Page 121 - Demo
P. 121
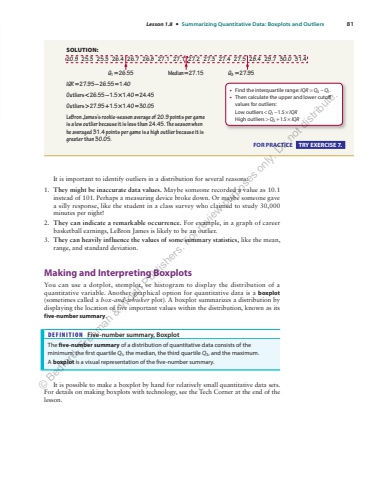
Lesson 1.8 %u2022 Summarizing Quantitative Data: Boxplots and Outliers 81 It is important to identify outliers in a distribution for several reasons: 1. They might be inaccurate data values. Maybe someone recorded a value as 10.1 instead of 101. Perhaps a measuring device broke down. Or maybe someone gave a silly response, like the student in a class survey who claimed to study 30,000 minutes per night! 2. They can indicate a remarkable occurrence. For example, in a graph of career basketball earnings, LeBron James is likely to be an outlier. 3. They can heavily influence the values of some summary statistics, like the mean, range, and standard deviation. Making and Interpreting Boxplots You can use a dotplot, stemplot, or histogram to display the distribution of a quantitative variable. Another graphical option for quantitative data is a boxplot(sometimes called a box-and-whisker plot). A boxplot summarizes a distribution by displaying the location of five important values within the distribution, known as its five-number summary. DEFINITION Five-number summary, Boxplot The five-number summary of a distribution of quantitative data consists of the minimum, the first quartile Q1 , the median, the third quartile Q3 , and the maximum. A boxplot is a visual representation of the five-number summary. It is possible to make a boxplot by hand for relatively small quantitative data sets. For details on making boxplots with technology, see the Tech Corner at the end of the lesson. SOLUTION: 20.9 25.3 25.3 26.4 26.7 26.8 27.1 27.1 27.2 27.3 27.4 27.5 28.4 29.7 30.0 31.4 Q1 =26.55 Median=27.15 Q3 =27.95IQR = %u2212 = 27.95 26.55 1.40 =Outliers < %u2212 26.55 1. %u2212 %u00d75 1 = .40 24.45 Outliers > + 27.95 1. + %u00d75 1 = .40 30.05 LeBron James%u2019s rookie-season average of 20.9 points per game is a low outlier because it is less than 24.45. The season when he averaged 31.4 points per game is a high outlier because it is greater than 30.05. FOR PRACTICE TRY EXERCISE 7. %u2022 Find the interquartile range: IQR Q= 3 1 %u2013Q . %u2022 Then calculate the upper and lower cutoff values for outliers: Low outliers < %u00d7 Q I 1 %u20131.5 QR High outliers > Q I 3 + %u00d7 1.5 QR%u00a9 Bedford, Freeman & Worth Publishers. For review purposes only. Do not distribute.
